Straight from the Desk
Syz the moment
Live feeds, charts, breaking stories, all day long.
- All
- us
- macro
- equities
- Food for Thoughts
- sp500
- Central banks
- Bonds
- markets
- bitcoin
- Asia
- technical analysis
- investing
- europe
- Crypto
- geopolitics
- tech
- gold
- performance
- Commodities
- AI
- nvidia
- ETF
- earnings
- Forex
- Real Estate
- oil
- banking
- magnificent-7
- Volatility
- nasdaq
- apple
- emerging-markets
- energy
- china
- Alternatives
- switzerland
- tesla
- trading
- sentiment
- russia
- Money Market
- assetmanagement
- UK
- ESG
- Middle East
- microsoft
- amazon
- ethereum
- meta
- bankruptcy
- Turkey
- Healthcare
- Industrial-production
- Global Markets Outlook
- africa
- brics
- Market Outlook
- Asset Allocation Insights
- Flash
- Focus
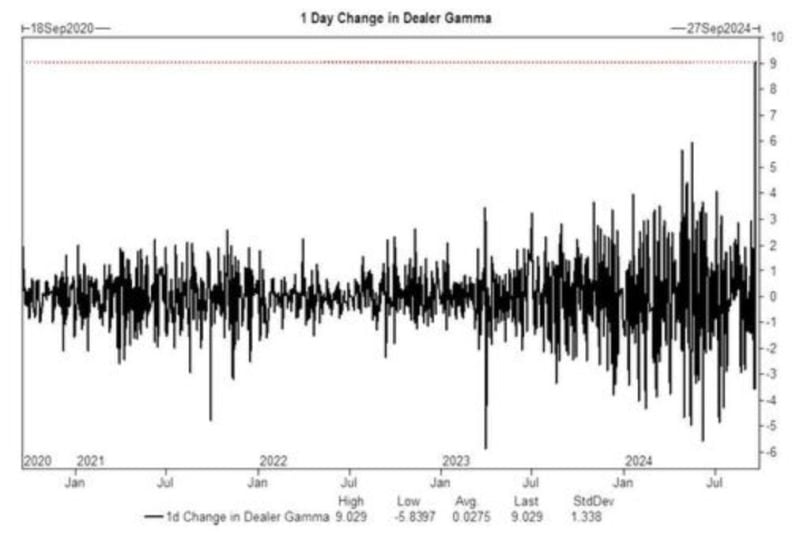
Friday's daily change in S&P 500 Dealer Gamma, $9 Billion, was the largest in history
Source: Barchart
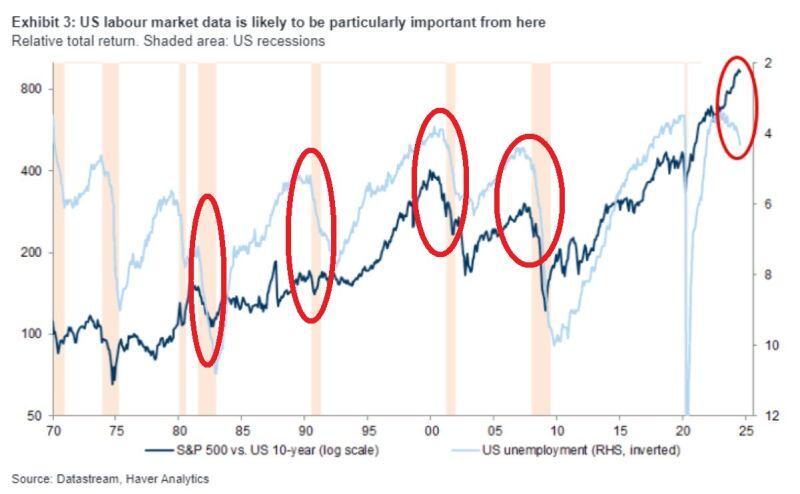
🚨US UNEMPLOYMENT RATE USUALLY RISES BEFORE THE S&P 500 CORRECTION🚨
US jobless rate rose from 3.4% in April 2023 to 4.2% in August near the highest in 3 years. In the past, when the unemployment rate was rising, the S&P 500 index saw significant declines. The us jobs reports in the coming weeks will be key... Source. Global Markets Investor
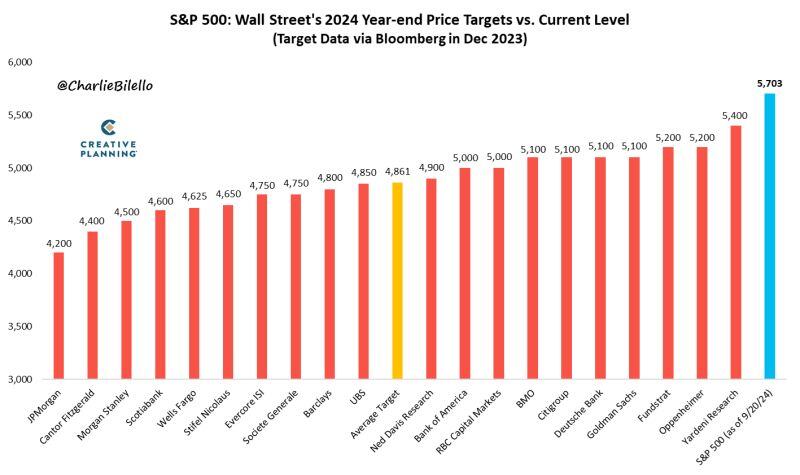
At 5,703, the S&P 500 is now over 300 points above above the highest 2024 year-end price target from Wall Street strategists and 17% above the average target (4,861).
And there's still 3 months to go in the year. $SPX Source: Charlie Bilello
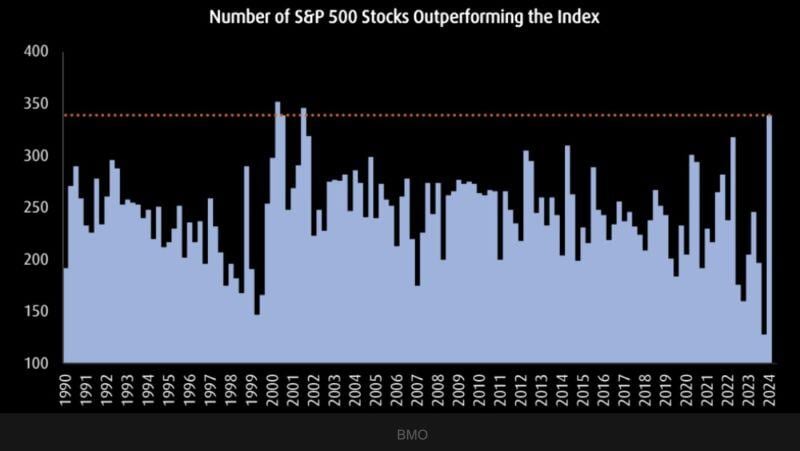
The number of sp500 stocks outperforming the index is the highest since 2002.
Source: Barchart, BMO
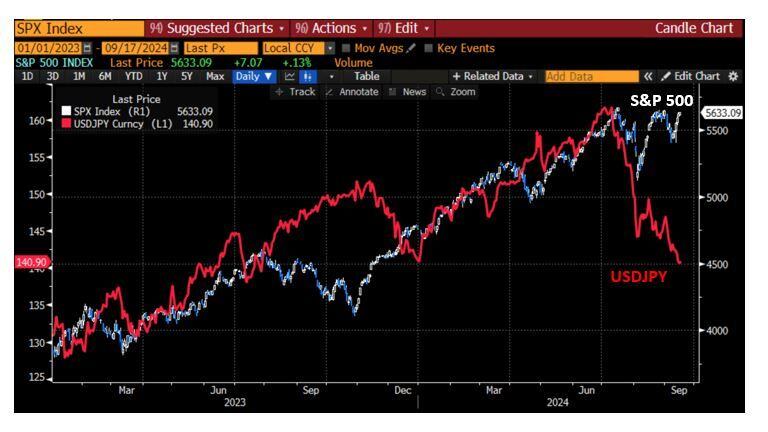
Remember when early August the strengthening of the yen and ensuing carry trade unwinding was seen as a huge threat for the equity market?
Fast forward to mid-September: the S&P 500 and USDJPY are taking two opposite directions. The market doesn't seem to care anymore about the yen... Source: Bloomberg, RBC
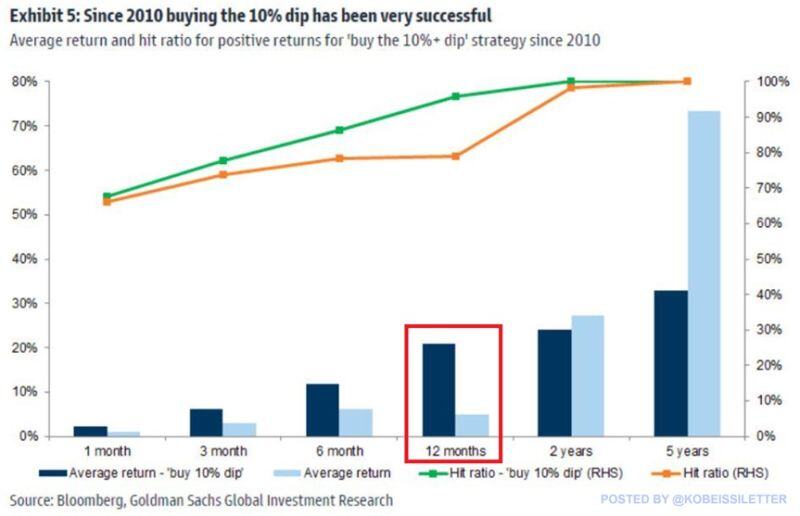
Is buying the dip still the best strategy? The average return when buying the dip in the S&P 500 varies based on timeframe.
Within 6 months of buying a -10% decline, the average return has been +13% compared to a +4% return when holding stocks through the pullback and recovery. Within 12 months, the "buy the dip" strategy has returned a +22% gain, beating a +5% return with the buy and hold strategy. On the other hand, buying dips over a 5-year period has returned +33%, well below a +75% from simply holding. In other words, buying the dip has been a successful strategy during periods of market volatility.
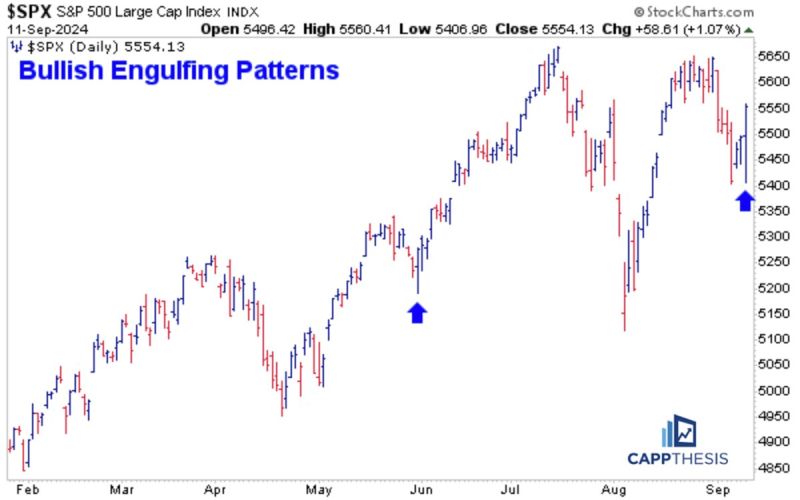
$SPX The last two bullish engulfing patterns:
Today and May 31st. Source: Frank Cappelleri
Investing with intelligence
Our latest research, commentary and market outlooks

