Straight from the Desk
Syz the moment
Live feeds, charts, breaking stories, all day long.
- All
- us
- macro
- equities
- Food for Thoughts
- sp500
- Central banks
- Bonds
- markets
- bitcoin
- Asia
- technical analysis
- investing
- europe
- Crypto
- geopolitics
- performance
- tech
- gold
- Commodities
- AI
- nvidia
- ETF
- earnings
- Forex
- Real Estate
- oil
- banking
- Volatility
- magnificent-7
- nasdaq
- apple
- china
- emerging-markets
- energy
- Alternatives
- switzerland
- trading
- tesla
- sentiment
- russia
- Money Market
- assetmanagement
- UK
- ESG
- Middle East
- microsoft
- amazon
- ethereum
- meta
- bankruptcy
- Turkey
- Healthcare
- Industrial-production
- Global Markets Outlook
- africa
- brics
- Market Outlook
- Asset Allocation Insights
- Flash
- Focus
- &summary="Based on the history, with the index up 113 bps at 3:00pm, the SP500 had a 99% chance of closing green. Its failure to do so is a remarkable stumble, to say the least." Source: Bespoke&source=https://blog.syzgroup.com/syz-the-moment/bespoke-about-yesterdays-last-hour-of-trading-' target="_blank">
Bespoke about yesterday's last hour of trading =>
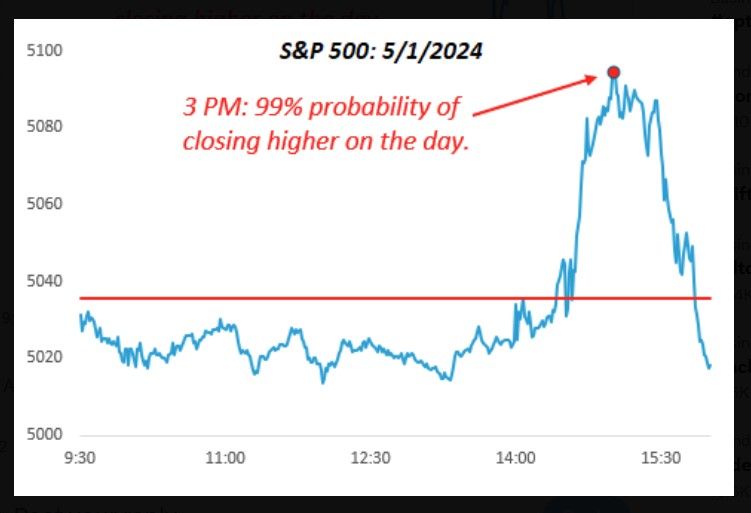
"Based on the history, with the index up 113 bps at 3:00pm, the SP500 had a 99% chance of closing green. Its failure to do so is a remarkable stumble, to say the least." Source: Bespoke
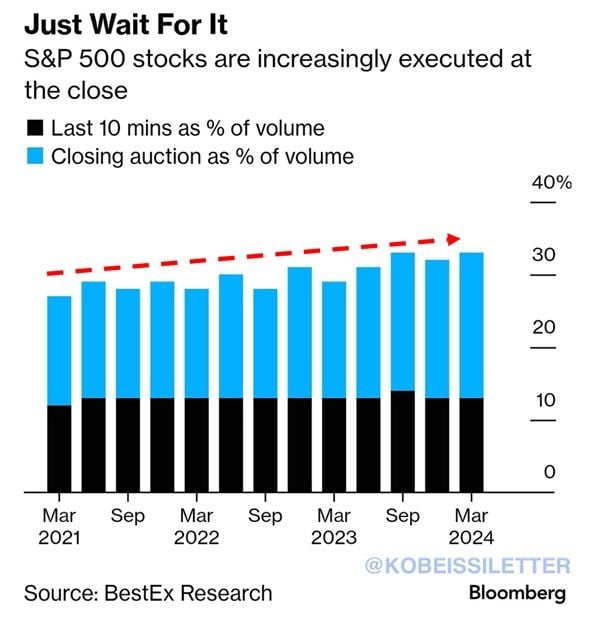
~33% of all S&P 500 stock trades are now executed in the last 10 minutes of the trading session.
This is up from ~27% in 2021 and has been steadily increasing over the last few months. The entire trading session lasts for 390 minutes, but ONE THIRD of all trades are done in the last 10. Interestingly, assets of passive equity funds such as ETFs have risen to nearly $12 trillion in the US, according to Bloomberg. These funds usually execute their trades near the end of a trading session. This explains the significant spike in volatility at the end of the day. Source: The Kobeissi Letter, Bloomberg
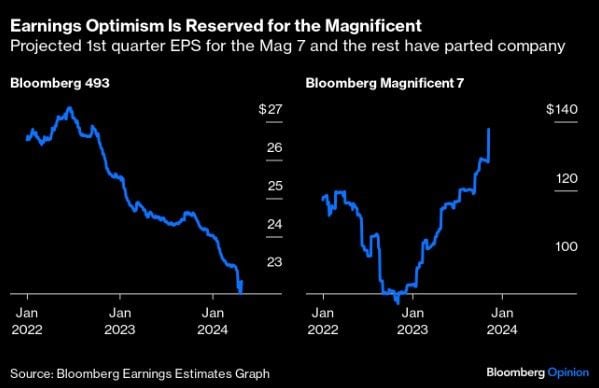
Projected Q1 earnings for the S&P 500 ex-Mag 7 (left-hand chart) vs. Projected Q1 earnings for the Mag 7...
Source: Bloomberg
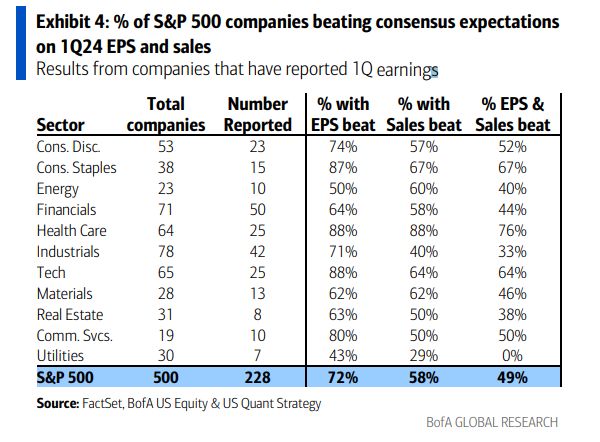
72% EPS beat rate so far
6.6% EPS growth SPX ex-Fins & Energy Source: Mike Zaccardi, BofA
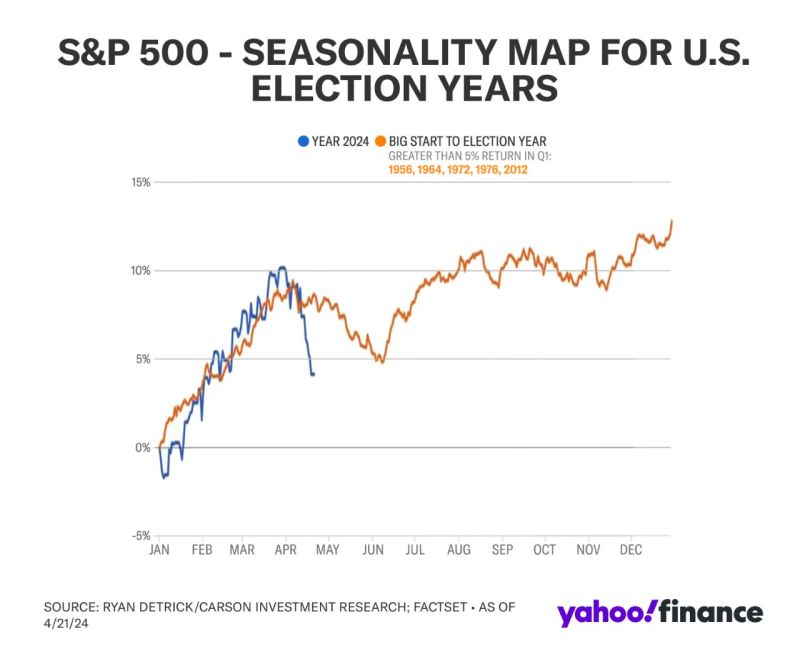
The chart below shared by Yahoo Finance newsletters thru Ryan Detrick, CMT shows that big starts to an election year (like '24) tend to see chop and weakness into June.
https://lnkd.in/eANaDtsN
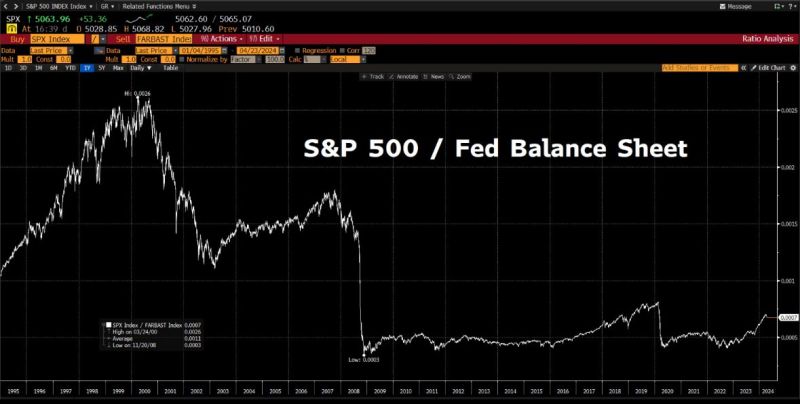
FINANCIAL GRAVITY as explained by Peruvian Bull:
If we divide the performance of the S&P 500 by the Fed’s Balance Sheet since the GFC, the LINE IS FLAT. This means that there has been basically NO REAL growth in stock prices since 2008- with the only rise in prices due to money printing. The correlation coefficient between central bank quantitative easing and the price of stock indexes is nearly 1... Source: Bloomberg
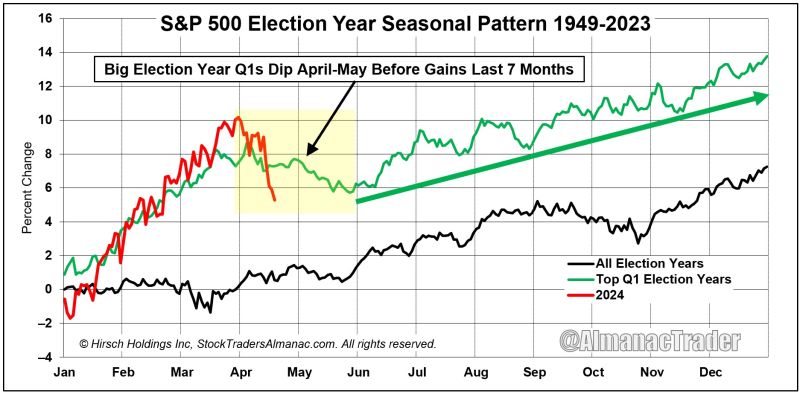
Big Election Year Q1s Dip April-May Before Gains Last 7 Months.
2024 is 3rd best Election Q1 since 1950 tracking. Historically, there is a dip in April-May before gains till year-ned. There was only 2 losses in the last 7 months of election years since 1950 (2000 & 2008) Source: Ryan Detrick, CMT, AlmanacTrader
Investing with intelligence
Our latest research, commentary and market outlooks

