Straight from the Desk
Syz the moment
Live feeds, charts, breaking stories, all day long.
- All
- us
- macro
- equities
- Food for Thoughts
- sp500
- Central banks
- Bonds
- markets
- bitcoin
- Asia
- technical analysis
- europe
- investing
- Crypto
- geopolitics
- performance
- gold
- tech
- Commodities
- AI
- nvidia
- ETF
- earnings
- Forex
- Real Estate
- banking
- oil
- Volatility
- china
- magnificent-7
- nasdaq
- apple
- emerging-markets
- energy
- Alternatives
- switzerland
- trading
- tesla
- sentiment
- russia
- Money Market
- assetmanagement
- UK
- ESG
- Middle East
- amazon
- microsoft
- ethereum
- meta
- bankruptcy
- Turkey
- Healthcare
- Industrial-production
- Global Markets Outlook
- africa
- brics
- Market Outlook
- Asset Allocation Insights
- Flash
- Focus
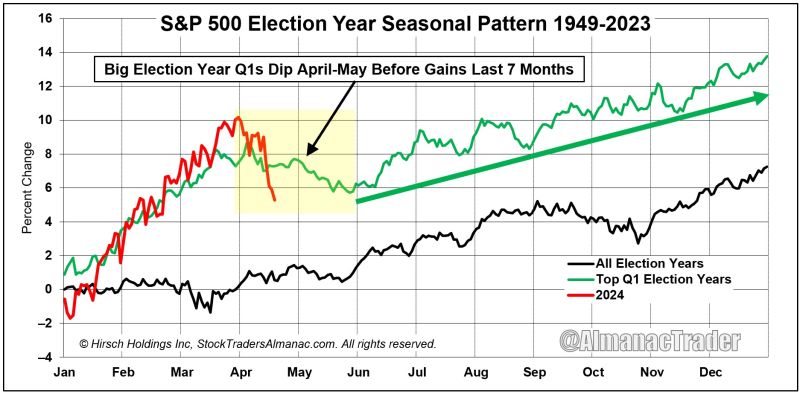
Big Election Year Q1s Dip April-May Before Gains Last 7 Months.
2024 is 3rd best Election Q1 since 1950 tracking. Historically, there is a dip in April-May before gains till year-ned. There was only 2 losses in the last 7 months of election years since 1950 (2000 & 2008) Source: Ryan Detrick, CMT, AlmanacTrader
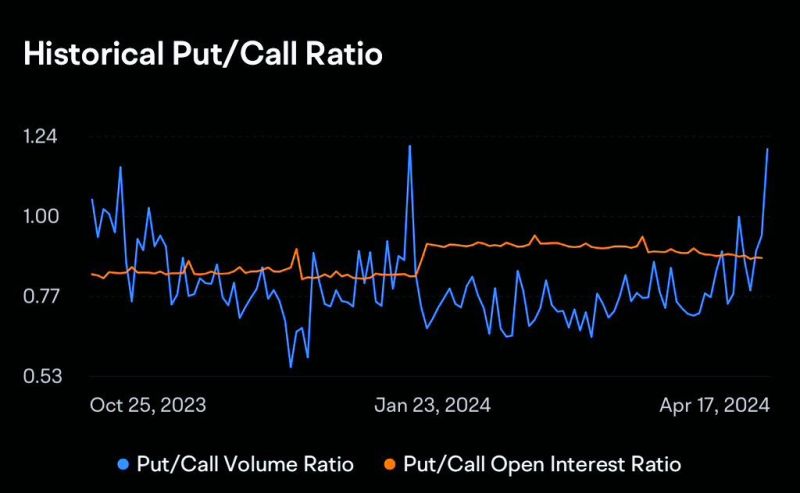
SP500 Put/Call Ratio has risen to multi-year highs amid the recent market sell off.
Source: David Marlin
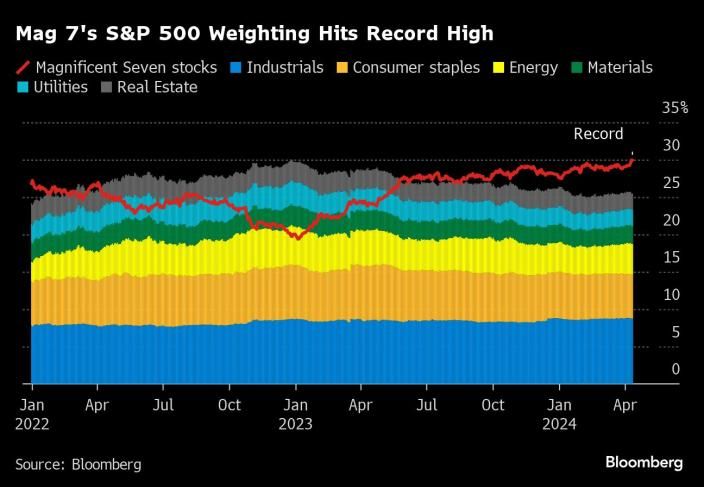
The Mag7's weighting in the SP500 just hit another new high
Source: Cheddar Flow
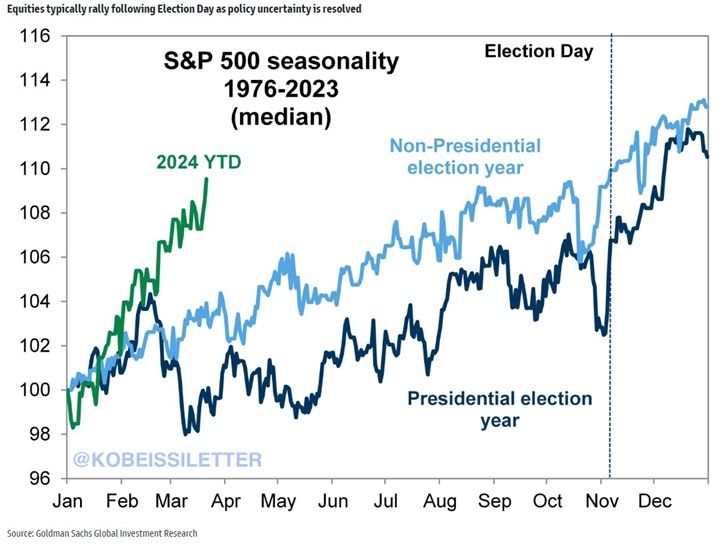
The S&P 500's performance has been truly outstanding this year.
The index is up 9% year to date which is more than DOUBLE the average YTD return in an election year. In the past, the median return during a US presidential election year was about 11%. There are still several months until the presidential election but the index is on track to significantly exceed its historical performance. Source: The Kobeissi Letter
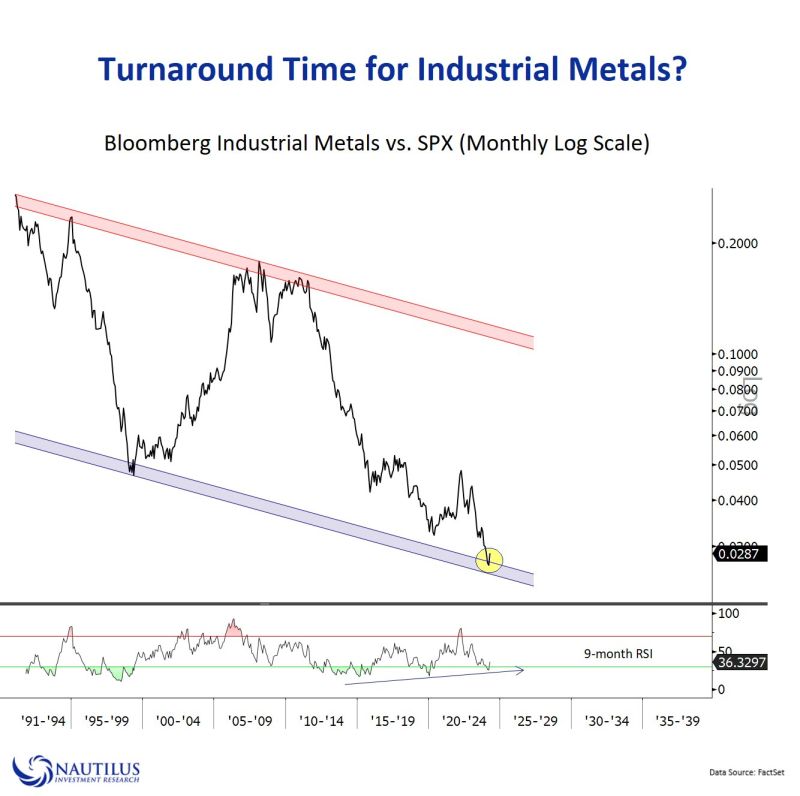
Industrial Metals relative strength (vs. $SPX) ready to turn?
Source: Nautilus Research
Investing with intelligence
Our latest research, commentary and market outlooks

