Straight from the Desk
Syz the moment
Live feeds, charts, breaking stories, all day long.
- All
- us
- macro
- equities
- Food for Thoughts
- sp500
- Central banks
- Bonds
- markets
- bitcoin
- Asia
- technical analysis
- investing
- europe
- Crypto
- geopolitics
- performance
- gold
- tech
- Commodities
- AI
- nvidia
- ETF
- earnings
- Forex
- Real Estate
- banking
- oil
- Volatility
- china
- magnificent-7
- nasdaq
- apple
- emerging-markets
- energy
- Alternatives
- switzerland
- trading
- tesla
- sentiment
- russia
- Money Market
- assetmanagement
- UK
- ESG
- Middle East
- amazon
- microsoft
- ethereum
- meta
- bankruptcy
- Turkey
- Healthcare
- Industrial-production
- Global Markets Outlook
- africa
- brics
- Market Outlook
- Asset Allocation Insights
- Flash
- Focus
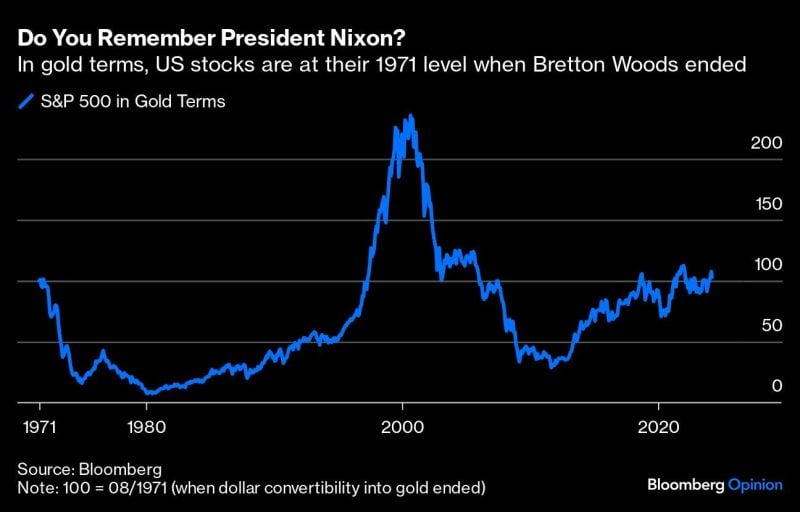
If one ignores dividends gold has been able to keep up with equities since Nixon ended things in 1971.
Source: Michel A.Arouet, Bloomberg
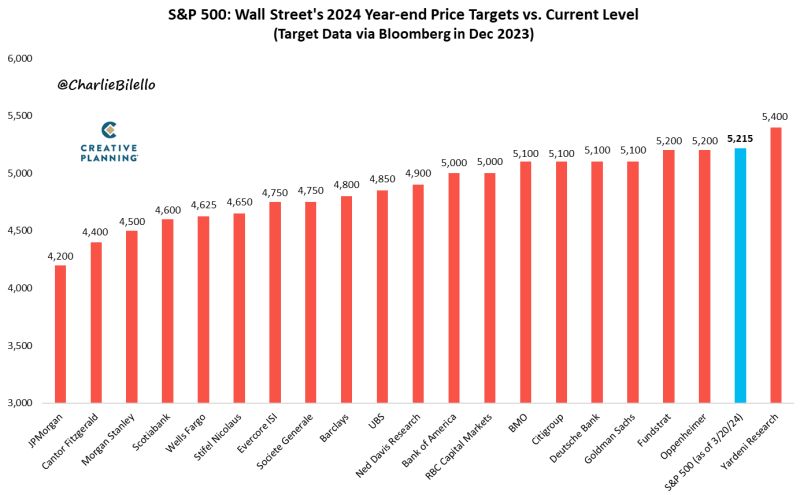
At 5,215, the S&P 500 is already 7.3% above the average 2024 year-end price target from Wall Street strategists (4,861). $SPX
Source: Charlie Bilello
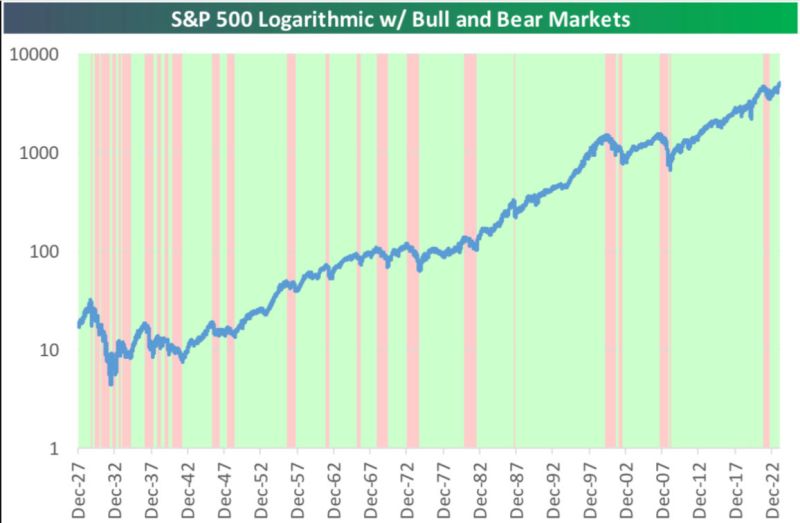
A little History in a Chart.
Green=Bull Markets 🐂 Red=Bear Markets 🐻 source : bespoke
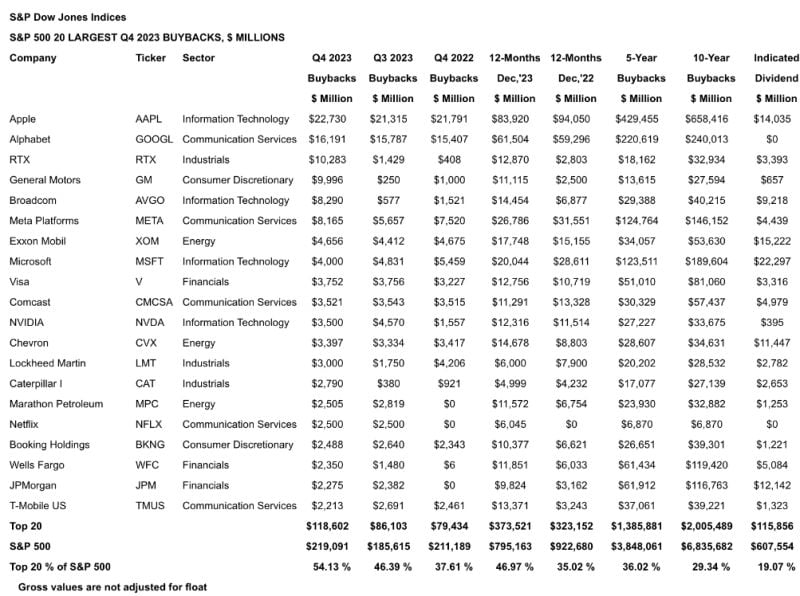
Here's the S&P 500 stocks that bought back the most shares in Q4 2023
1 Apple $AAPL: $22.7B 2 Google $GOOGL: $16.2B 3 Raytheon $RTX: $10.3B 4 General Motors $GM: $10B 5 Broadcom $AVGO: $8.3B 6 Facebook $META: $8.2B 7 Exxon Mobil $XOM: $4.7B 8 Microsoft $MSFT: $4b 9 Visa $V: $3.8B 10 Comcast $CMCSA $3.5B source : StockMKTNewz
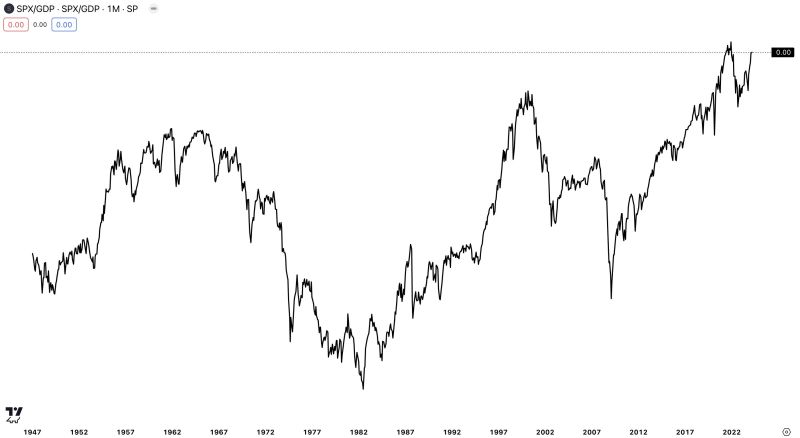
$SPX/GDP, the 'Buffet' indicator, is back near the 2021 highs
Source: Swordfishvegetable
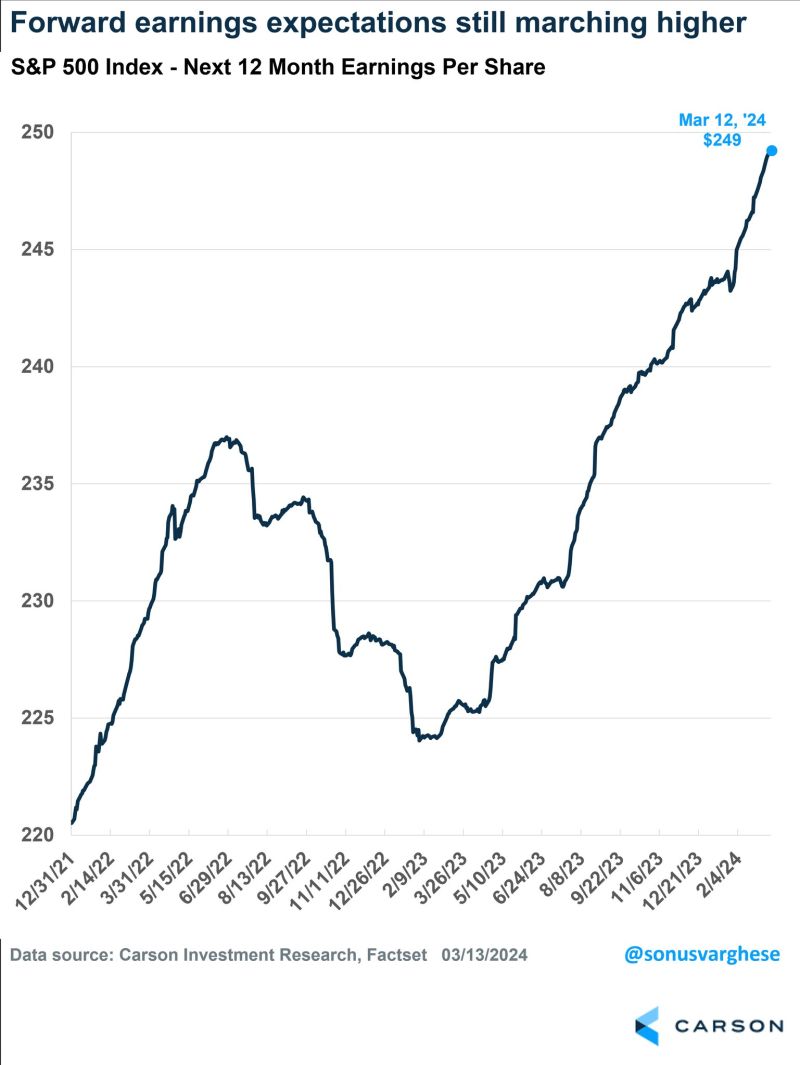
Why has the sp500 been moving higher despite rate cuts expectations being revised downward?
It is as simple as EPS 12 month estimates have soared. Up another 2% the past 12 months. Source: Ryan Detrick
Investing with intelligence
Our latest research, commentary and market outlooks

