Straight from the Desk
Syz the moment
Live feeds, charts, breaking stories, all day long.
- All
- us
- macro
- equities
- Food for Thoughts
- sp500
- Central banks
- Bonds
- markets
- bitcoin
- Asia
- technical analysis
- investing
- europe
- Crypto
- geopolitics
- tech
- performance
- gold
- Commodities
- AI
- nvidia
- ETF
- earnings
- Forex
- Real Estate
- oil
- banking
- Volatility
- magnificent-7
- nasdaq
- apple
- emerging-markets
- energy
- china
- Alternatives
- switzerland
- trading
- tesla
- sentiment
- russia
- Money Market
- assetmanagement
- UK
- ESG
- Middle East
- microsoft
- amazon
- ethereum
- meta
- bankruptcy
- Turkey
- Healthcare
- Industrial-production
- Global Markets Outlook
- africa
- brics
- Market Outlook
- Asset Allocation Insights
- Flash
- Focus
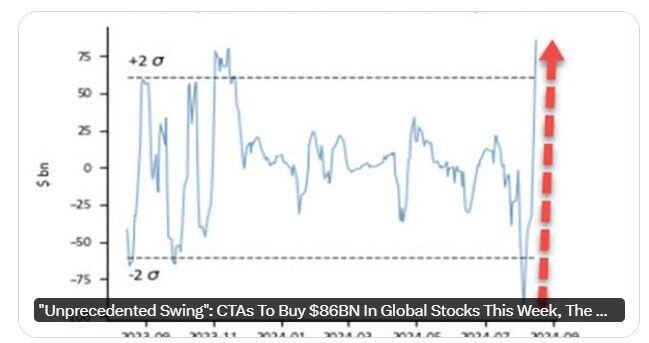
"Unprecedented Swing": CTAs To Buy $86BN In Global Stocks This Week, The Most On Record
Source: zerohedge, Goldman
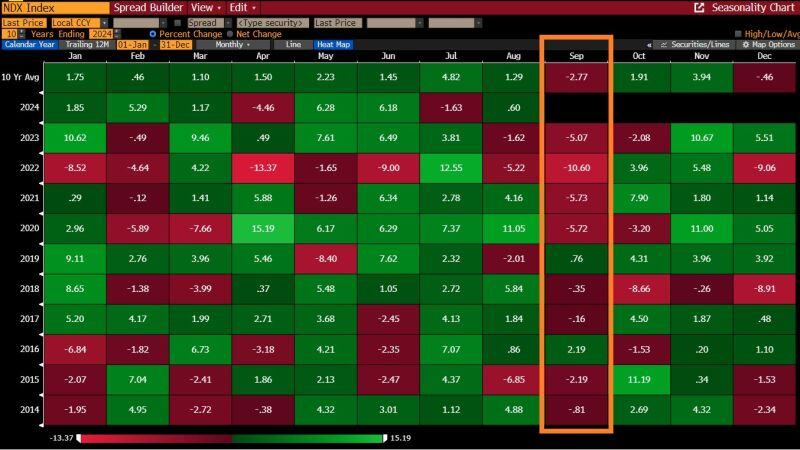
If July is a great month for the Nasdaq, September is not
Source: Bloomberg, zerohedge
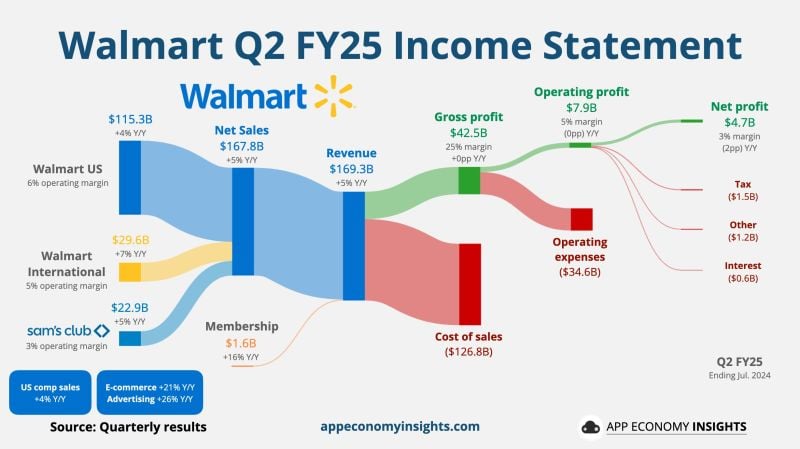
$WMT Walmart Q2 FY25 (ending in July):
• Revenue +5% Y/Y to $169.3B ($1.9B beat). • Non-GAAP EPS $0.67 ($0.02 beat). • Walmart US comp sales +4%. • E-commerce +21% Y/Y. • Advertising +26% Y/Y. FY25 Guidance: • Net sales +3.75% to 4.75% Y/Y (0.75% raise). Source: App Economy Insights
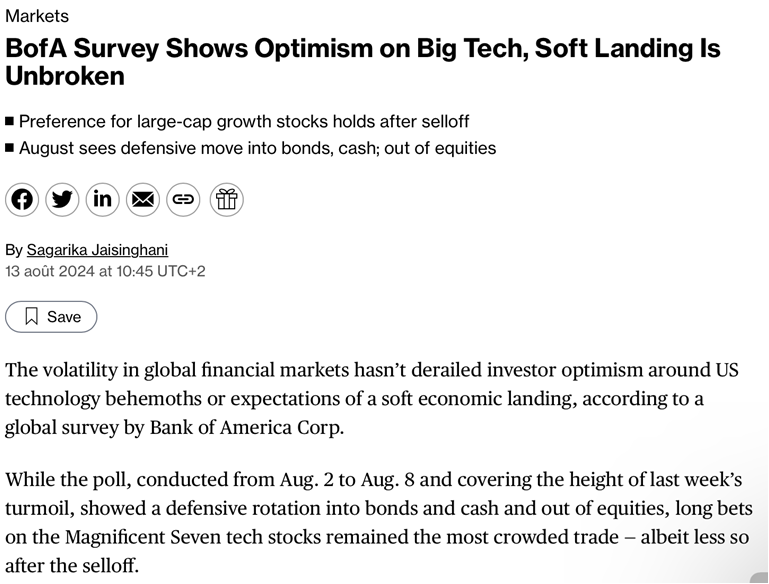
Bank of America survey shows continued optimism on Big Techs
Source: Bloomberg
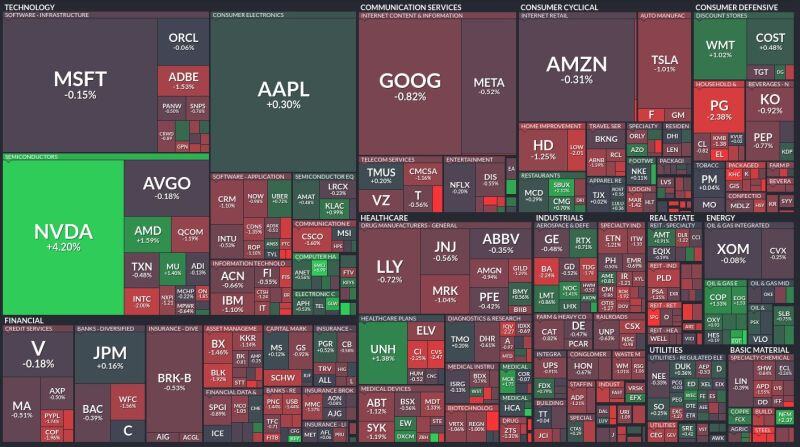
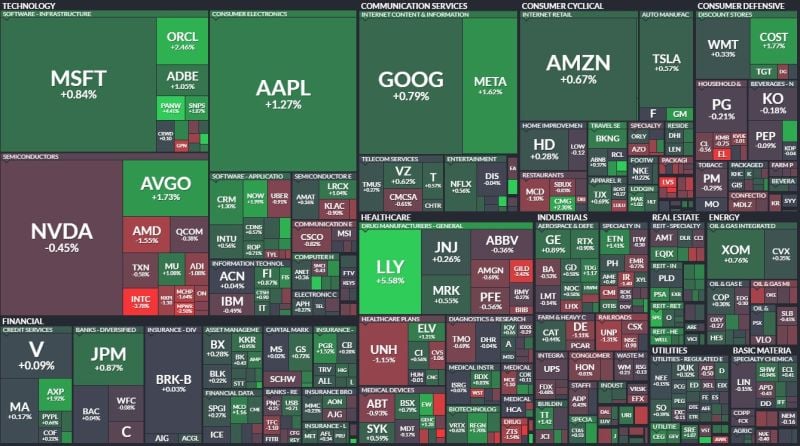
There's the rest of the market .. and then there's $NVDA
Source: Markets & Mayhem
After posting its worst and best day in over a year, the S&P 500 just closed the week down 2 POINTS.
That's a 0.04% decline in a week when the $VIX hit 65... Source: The Kobeissi Letter, Bloomberg
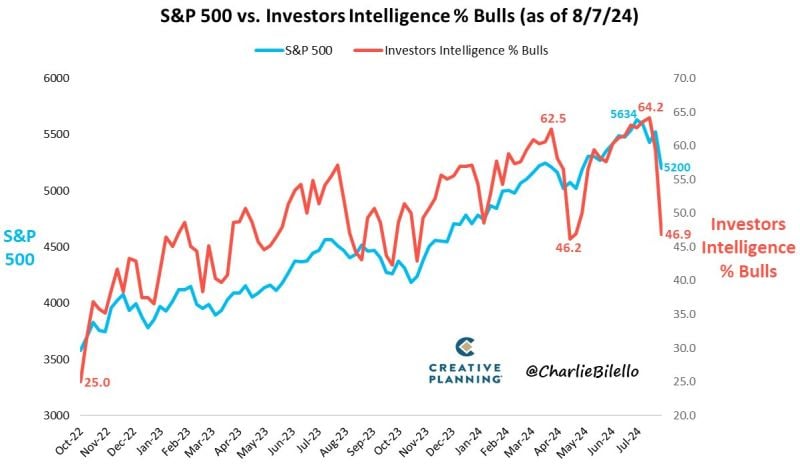
The % of Bulls in the Investors Intelligence Sentiment Index moved down over 17% in the past 2 weeks (from 64.2% to 46.9%)
That's the biggest 2-week % drop in Bulls since the October 1987 crash. Source: Charlie Bilello
Investing with intelligence
Our latest research, commentary and market outlooks

