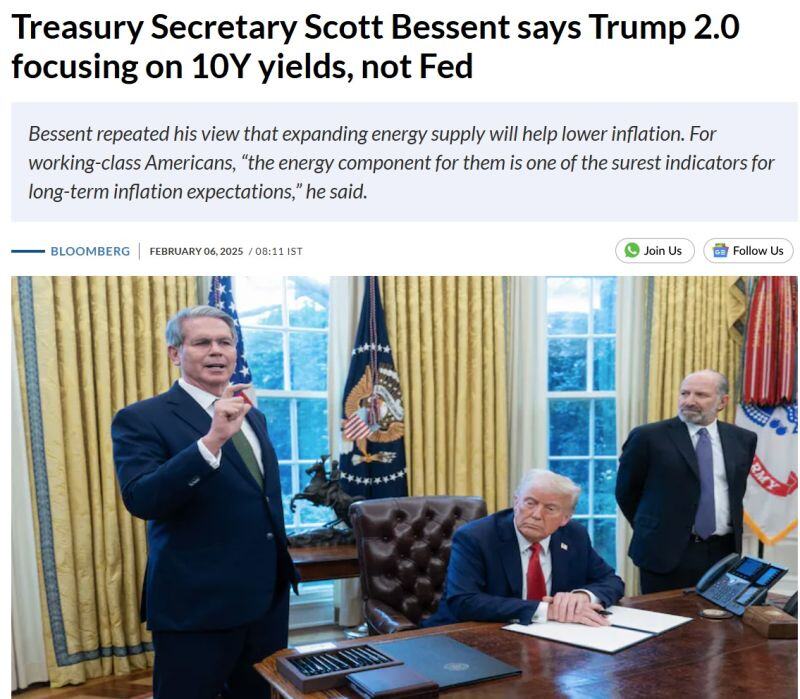
Treasury Secretary Scott Bessent says Trump 2.0 focusing on 10Y yields, not Fed
Bessent repeated his view that expanding energy supply will help lower inflation. For working-class Americans, “the energy component for them is one of the surest indicators for long-term inflation expectations,” he said. Cheap capital is coming... Source: www.moneycontrol.com
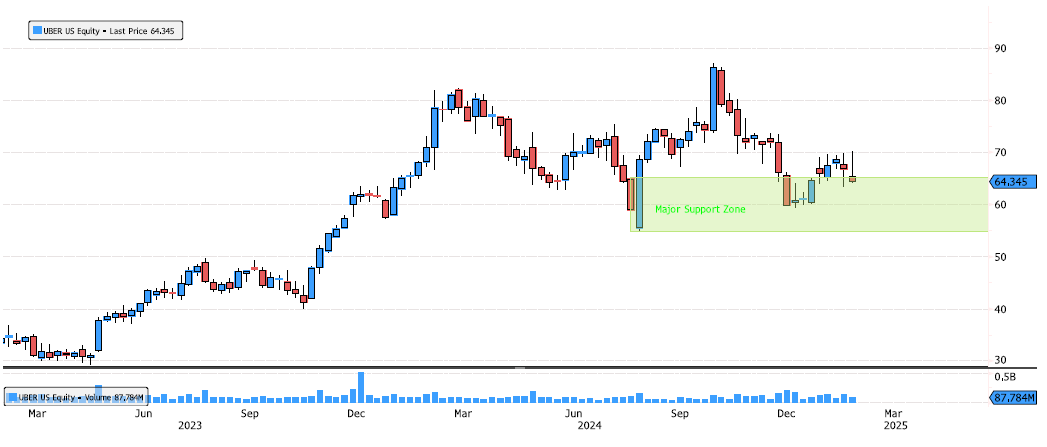
Uber on Major Support Zone
Uber (UBER US) is testing once again the major support zone between 54.84-65.25. The stock has consolidated 31% since October. Keep an eye on the price action for potential opportunities. Source: Bloomberg
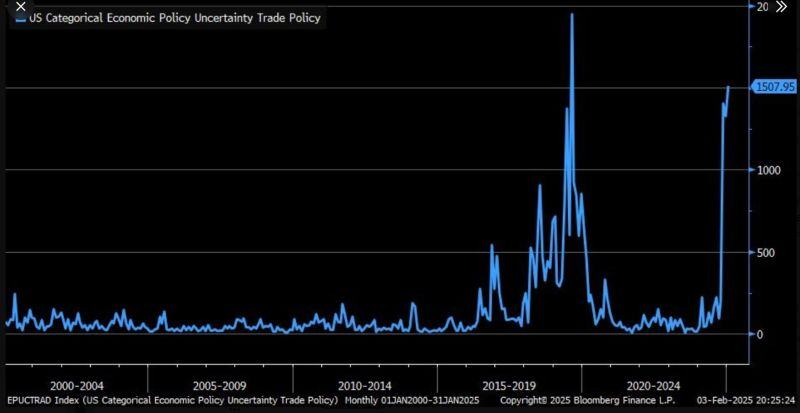
Trade Policy Uncertainty Index hits 2nd highest level in AT LEAST the last 25 years
source : barchart
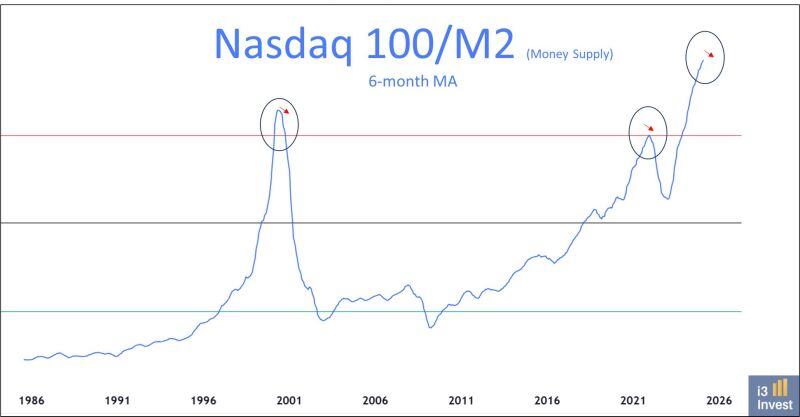
As shared by Guilherme Tavares i3 invest :
Nasdaq 100 / M2 Levels never seen before...
Xi’s Reply to Trump Tariffs Shows China Has More to Lose - Bloomberg
https://lnkd.in/ez4qCpZa Source: Bloomberg thru C.Barraud

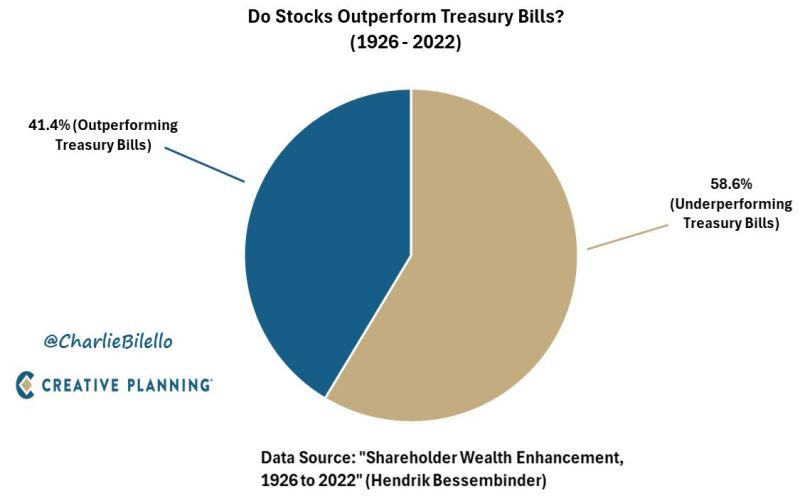
A majority of stocks (59%) underperform Treasury bills over their lifetime and more than half end up having a negative cumulative return.
“Don’t look for the needle in the haystack. Just buy the haystack.” - Jack Bogle Source: Charlie Bilello, Peter Malouk
Job Openings Unexpectedly Crater By More Than 500K In December
Source: zerohedge

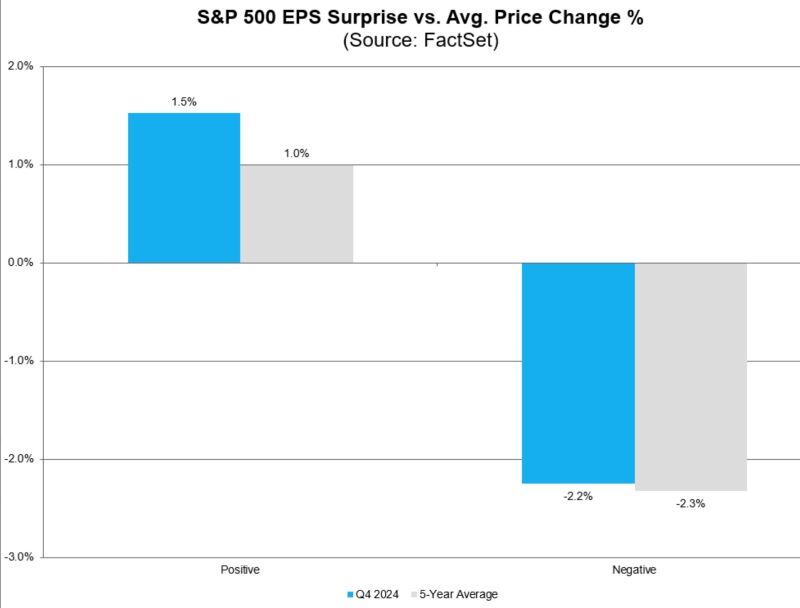
With deepSeek and tariffs, we almost forgot that we are in the middle of the earnings season.
FactSet notes that beats are being rewarded above average and misses are being punished around average.