Straight from the Desk
Syz the moment
Live feeds, charts, breaking stories, all day long.
- All
- us
- macro
- equities
- Food for Thoughts
- sp500
- Central banks
- Bonds
- Asia
- bitcoin
- markets
- technical analysis
- investing
- europe
- Crypto
- Commodities
- geopolitics
- tech
- performance
- gold
- ETF
- nvidia
- AI
- earnings
- Forex
- Real Estate
- oil
- banking
- Volatility
- apple
- nasdaq
- emerging-markets
- magnificent-7
- Alternatives
- energy
- switzerland
- trading
- tesla
- sentiment
- china
- russia
- Money Market
- assetmanagement
- UK
- ESG
- Middle East
- amazon
- ethereum
- microsoft
- meta
- bankruptcy
- Industrial-production
- Turkey
- Healthcare
- Global Markets Outlook
- brics
- africa
- Market Outlook
- Flash
- Focus
The Timeline of U.S. Government Shutdowns ⏱️⏱️⏱️⏱️
House Republican leaders canceled a planned two-week recess as a government shutdown appeared more likely after they failed to pass a short-term spending bill with fewer than two days to avoid the shutdown. House Speaker Kevin McCarthy informed the GOP caucus of the canceled break at a closed-door meeting after more than 20 Republicans embarrassed him by voting with Democrats to defeat the bill. The government is scheduled to shut down at 12:01 a.m. ET Sunday if a funding bill is not approved by Congress and President Joe Biden. Source: Statista, CNBC
There we go again...
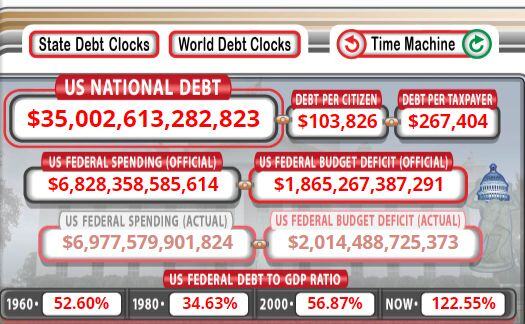
The game of chicken is on...The US government is now just 48 hours away from a SHUTDOWN. This comes less than 3 months after the largest debt ceiling crisis since 2011. Meanwhile, the government is borrowing over $14 billion PER DAY and spending $3 billion per day on interest expense alone. According to Goldman, a government-wide shutdown would reduce quarterly annualized growth by around 0.2% for each week it lasted after accounting for modest private sector effects. Goldman's baseline is that a shutdown could last for 2-3 weeks (the Trump government shutdown, the longest in history, lasted 35 days, from Dec 22, 2018 to Jan 25, 2019). - Meanwhile, Bloomberg also speculates that in an extreme tail event, the maximum hit to 4Q GDP would be a drag of 2.8% if the shutdown lasts for the entire quarter. Source cartoon: San Diego Tribune
Aryzta 5 year breakout ?
Aryzta (ARYN SW) is trying to breakout the 5 year consolidation. Last two attemps in April and July failed. Will it have enough strenght this time ? Source : Bloomberg
This is not the chart of an AI or crypo
It is the chart of India BSE small & medium IPO index Source: Amit Jeswani
US equites sector valuations vs. history
>>> Energy as the standout cheap one< trades at a material discount to the S&P 500 due to lower growth characteristics and concerns about the duration of the cycle. Source: Goldman Sachs, TME
Investing with intelligence
Our latest research, commentary and market outlooks