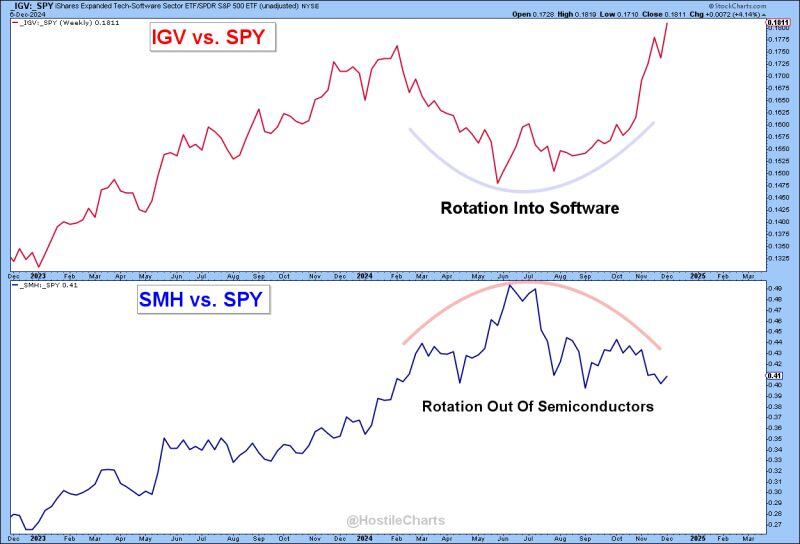
"Rotation is the Lifeblood of a Bull Market"
As Semis $SMH cooled off, they handed the baton to Software $IGV. The result? $XLK closed at new ATHs this week. Software & Semis now carry roughly equal weight in the S&P 500 $SPY. Source: Larry Thompson, CMT CPA @HostileCharts
Timeless advice...
Source: AZ Quotes
“The biggest communication problem is we don't listen to understand. We listen to reply.”
Source: Vala Afshar @ValaAfshar
#france
Source: The Economist

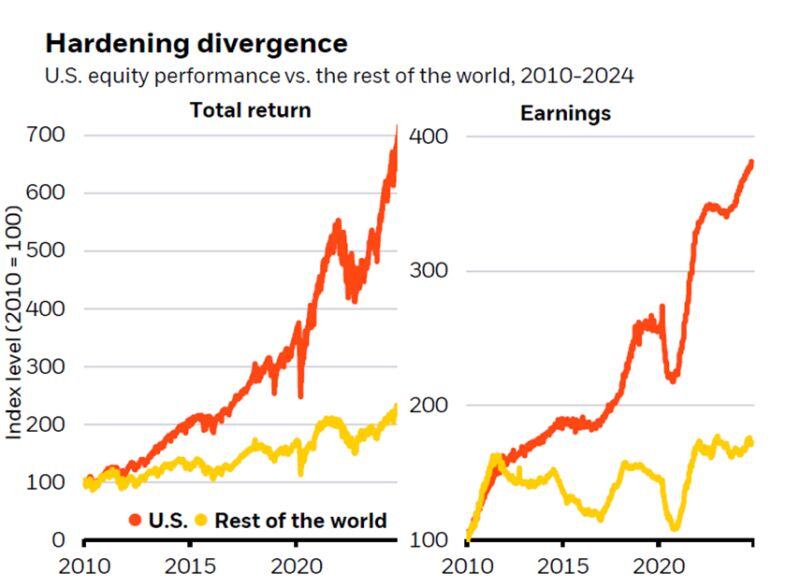
US stock market returns & earnings
Source: @MikeZaccardi
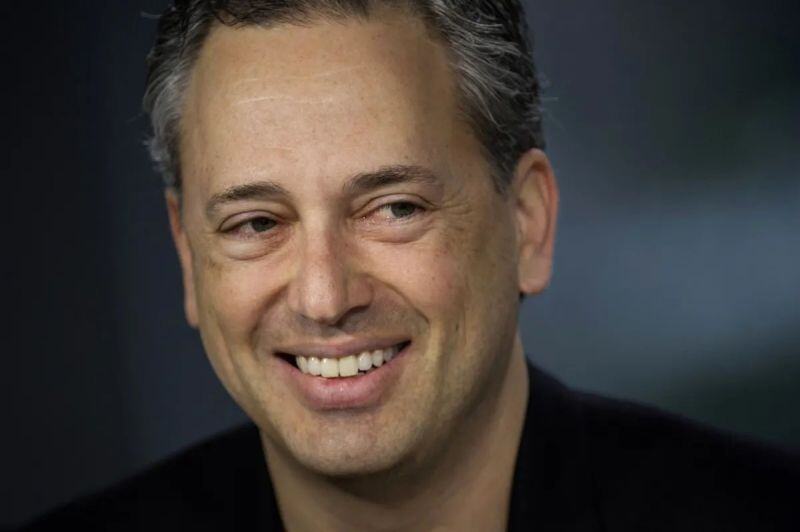
BREAKING >>> Trump has appointed David Sacks as the White House "AI & Crypto Czar."
Sacks will create a legal framework for the U.S. crypto industry to provide clarity and foster growth. Sacks is a known Solana ($SOL) bag holder Source: Truth Social, Bloomberg @DavidSacks
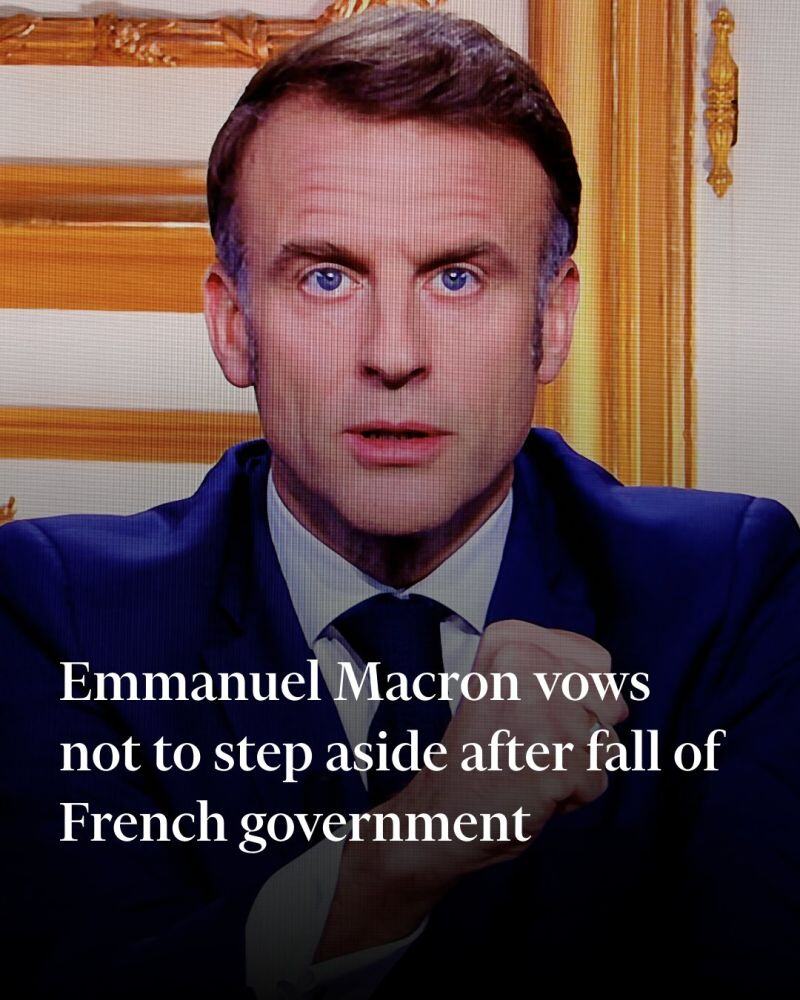
French President Emmanuel Macron came out fighting against opposition parties who he said “chose chaos”
by bringing down his premier in a historic no-confidence vote, vowing not to step aside before the end of his term. “The mandate that you have entrusted to me democratically is a five-year mandate, and I will exercise it fully until its end,” Macron said on Thursday. Macron’s term runs until 2027, but he is facing rising pressure from opposition groups to step down early. The president said he would name a new prime minister “in the coming days”, as he hit out at the far-right Rassemblement National and the leftist Nouveau Front Populaire alliance. Source: FT >>> https://on.ft.com/4ikxkhz
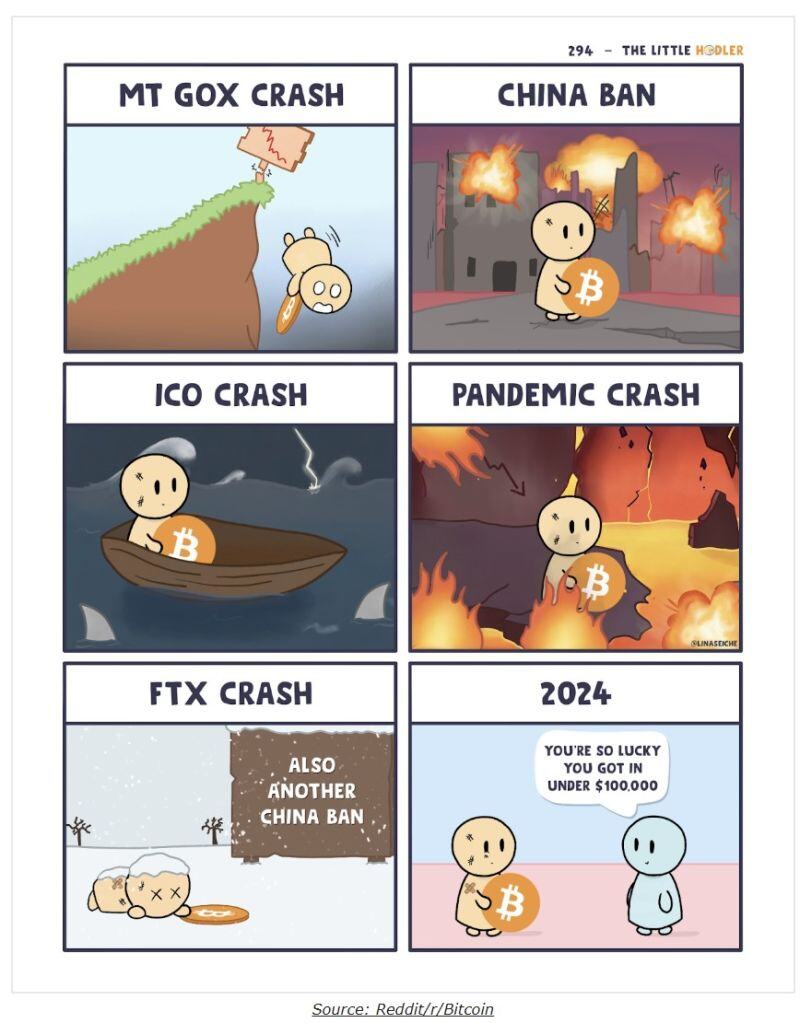
Bitcoiners had to endure a run of * counts fingers * FIVE black swan events in the span of 8 years, each resulting in price dumps anywhere from 50% to 80%…
Source: Milk Road, Reddit