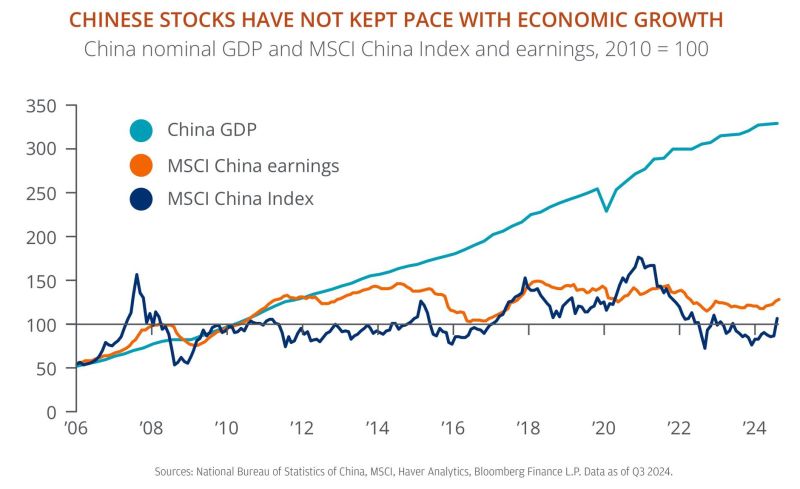
GDP growth does not always correlate with earnings and equities performance
Source: Michel A.Arouet
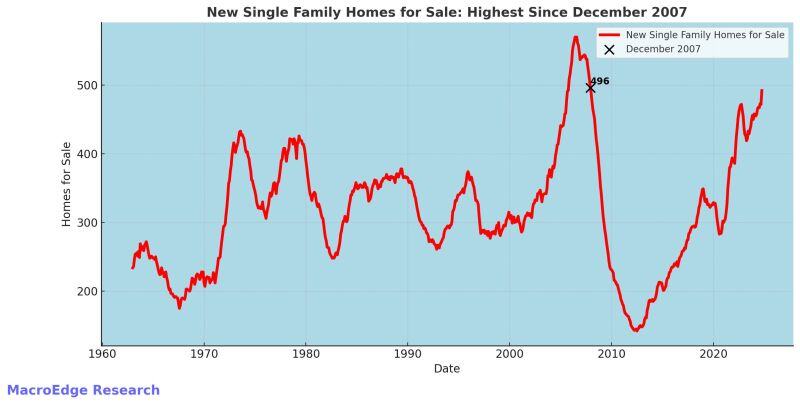
Total unsold US (single family) new homes for sale now at its highest level since...December 2007.
The increase in unsold homes takes place as housing affordability is near all-time low (mortgage rates AND prices are too high). A few remarks though: -There is a lack of inventory in some states while in other states inventory is building up due to population loss. - The chart is NOT normalized by population. The US population is about twice that compared to 1960. If you normalize the number from today compared to 1960, they might actually be the same. Source: Don Johnson @DonMiami3
BofA: With the S&P 500 up ~50% over the last two years, history suggests more modest index gains going forward.
Returns were most frequently in the 0-10% range following periods where the index was up 40-50% over a two-year period Source: Mike Zaccardi, CFA, CMT, MBA

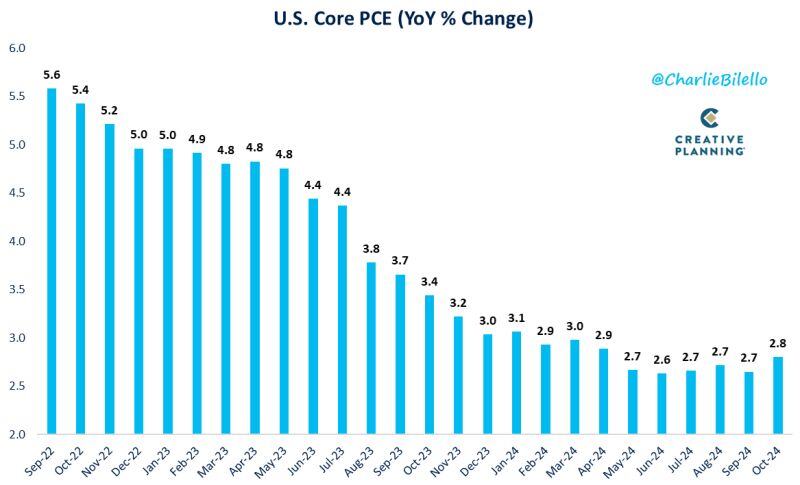
BREAKING: October PCE inflation, the Fed's preferred inflation measure, RISES to 2.3%, in-line with expectations of 2.3%.
Core PCE inflation RISES, to 2.8%, in-line with expectations of 2.8%. The Fed's preferred measure of inflation hit its highest reading since April. Core CPI, PPI, and PCE are all back on the rise. Source: Charlie Bilello
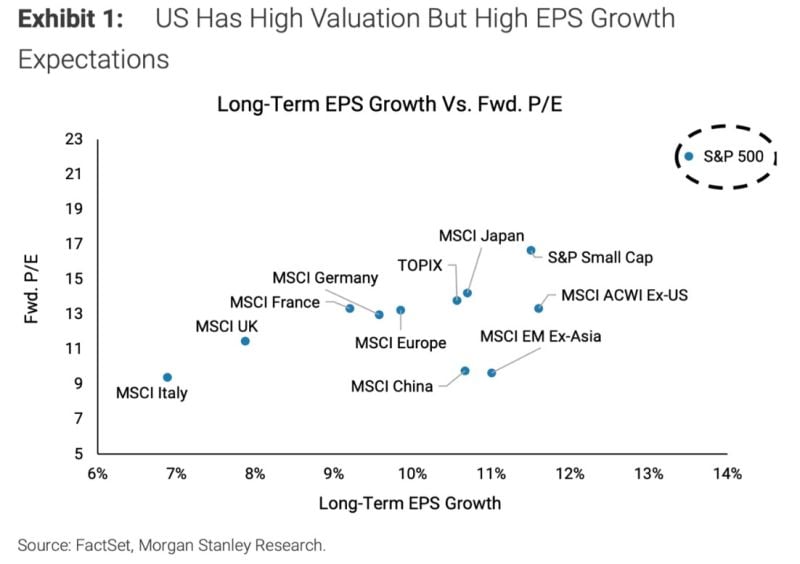
US equities: elevated P/E and high growth expectations.
Better for earnings to deliver in order to keep the PEG at reasonable level Source: Morgan Stanley Research
Michael Saylor $MSTR: "I am not selling"
Source: Trend Spider

This is the largest daily gold selloff in four years (-3.5%)
Primarily due to profit-taking transitioning into long liquidation after last week's strong rally, Israel's Netanyahu "in principle" approval of a Lebanon ceasefire deal and the announcement of Scott Bessent as President-elect Donald Trump's nominee for US Treasury Secretary. Bessent is seen as another advocate of a smaller government and budget deficits. Source chart: Bloomberg, Tavi Costa

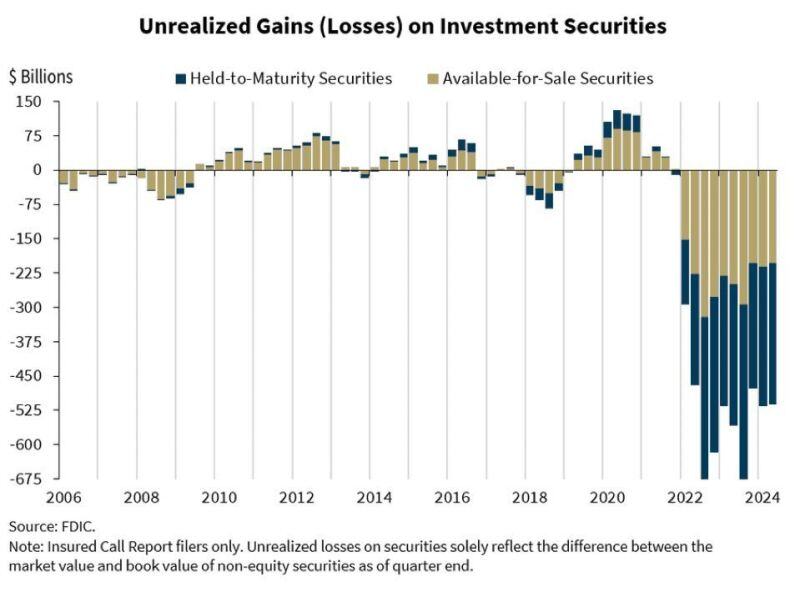
BREAKING 🚨: U.S. banks are now grappling with a whopping $515 billion in unrealized losses.
To put it into perspective, that's over 8x higher than during the 2008 financial crisis. Source: BofA, Jacob King