Straight from the Desk
Syz the moment
Live feeds, charts, breaking stories, all day long.
- All
- us
- macro
- equities
- Food for Thoughts
- sp500
- Central banks
- Bonds
- markets
- bitcoin
- Asia
- technical analysis
- investing
- europe
- Crypto
- geopolitics
- tech
- performance
- gold
- Commodities
- AI
- nvidia
- ETF
- earnings
- Forex
- Real Estate
- oil
- banking
- magnificent-7
- Volatility
- nasdaq
- apple
- emerging-markets
- energy
- china
- Alternatives
- switzerland
- tesla
- trading
- sentiment
- russia
- Money Market
- assetmanagement
- UK
- ESG
- Middle East
- microsoft
- amazon
- ethereum
- meta
- bankruptcy
- Turkey
- Healthcare
- Industrial-production
- Global Markets Outlook
- africa
- brics
- Market Outlook
- Asset Allocation Insights
- Flash
- Focus
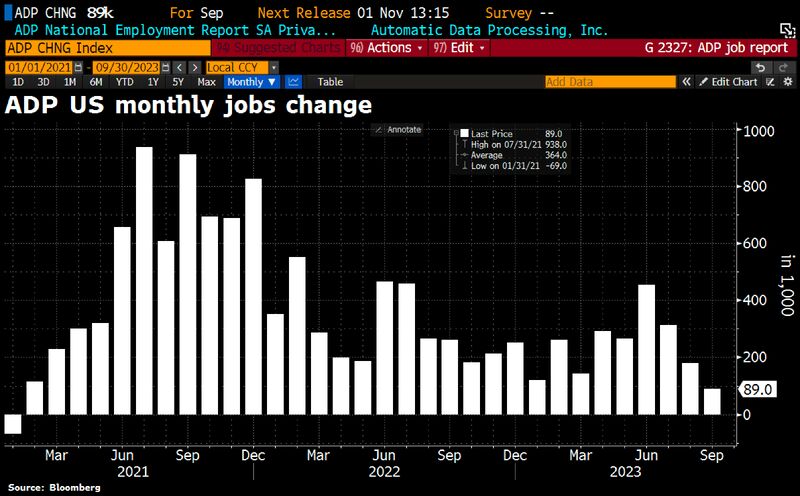
Is ADP the start of something big or an anomaly, knowledge_vital asks as ADP report for September saw a huge drop in new jobs to just 89k vs. 150k forecast, & down from +180k in Aug
The 89k is the softest number since Jan 2021. Large comps drove downside, they shed 83k jobs in September. Souce: HolgerZ, Bloomberg
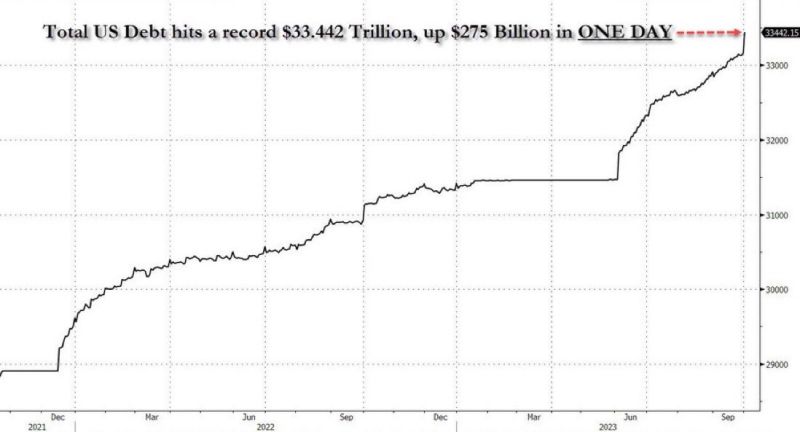
IS THE US ENTERING A DEBT SPIRAL LEADING TO A SOVEREIGN DEBT CRISIS?
Goldman, JP Morgan and BofA pull the alarm US debt is going parabolic! Total US debt rose by $275 billion in just ONE DAY. The US has added $32 billion in debt per day for the last 2 weeks. At the current pace, the US will add $1 trillion of debt in a month. Meanwhile: - David Lebovitz of JPMorgan Asset Management says something will break if rates continue to rise at the pace they've been going - "Fed hiking cycles always end with default & bankruptcy of extended governments, corporations, banks, investors." - BofA - Goldman Sachs: "There is a significant risk that FCIs continue to tighten until something breaks… (...) All roads appear to be leading to a continued sell-off in US + DM Rates as the market struggles to find the right clearing level for bonds (...) Risks are growing of a sharp, impulsive negative feedback loop in to other markets Source: Max Keiser, www.zerohedge.com
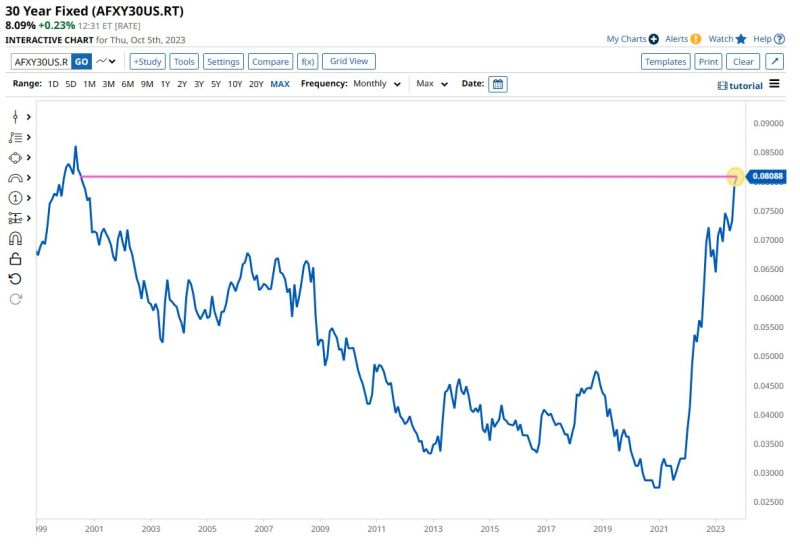
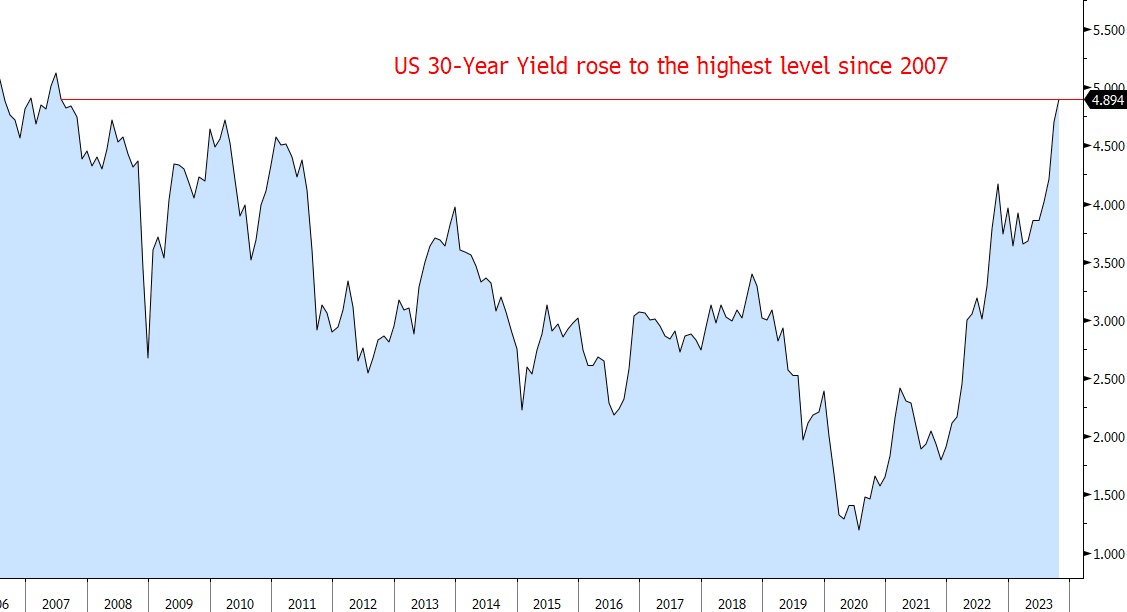
US 30Year Yield reaches 2007 High
The US 30-year yield rose to the highest level since 2007. This week's Treasury selloff came after US lawmakers managed to avert a government shutdown, prompting traders to increase bets that the Federal Reserve will raise rates in November.
Investing with intelligence
Our latest research, commentary and market outlooks

