16 Aug 2024
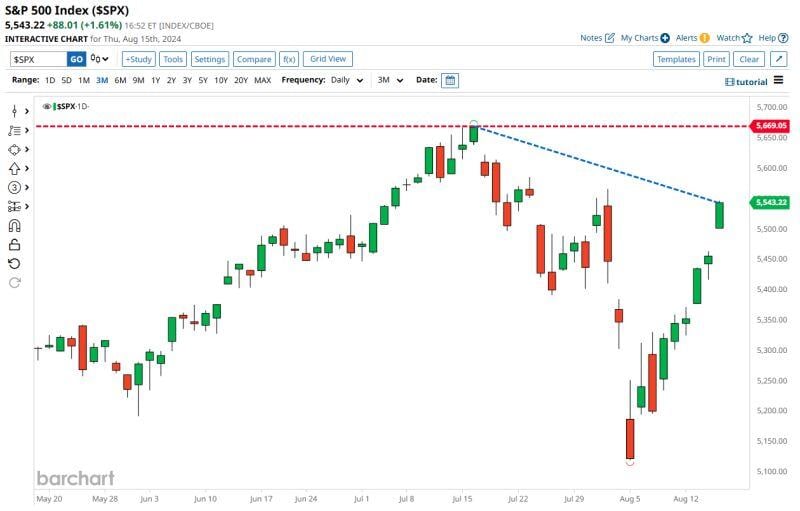
After escaping a black Monday (and the 2nd largest surge in the vix ever) over a week ago, the S&P 500 $SPX is only 2.2% away from all-time highs
Source: Barchart
16 Aug 2024
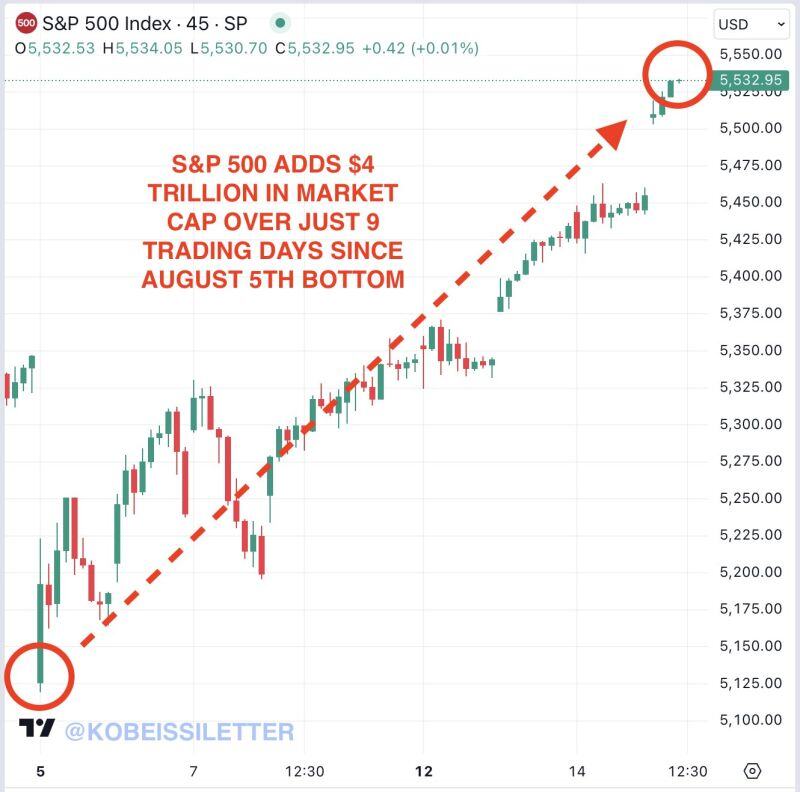
BREAKING 🚨 The S&P 500 has added nearly $4 TRILLION in market cap since the August 5th bottom
That's $4 trillion in 9 trading days or $444 billion PER TRADING DAY since August 5th. Source: The Kobeissi Letter
15 Aug 2024
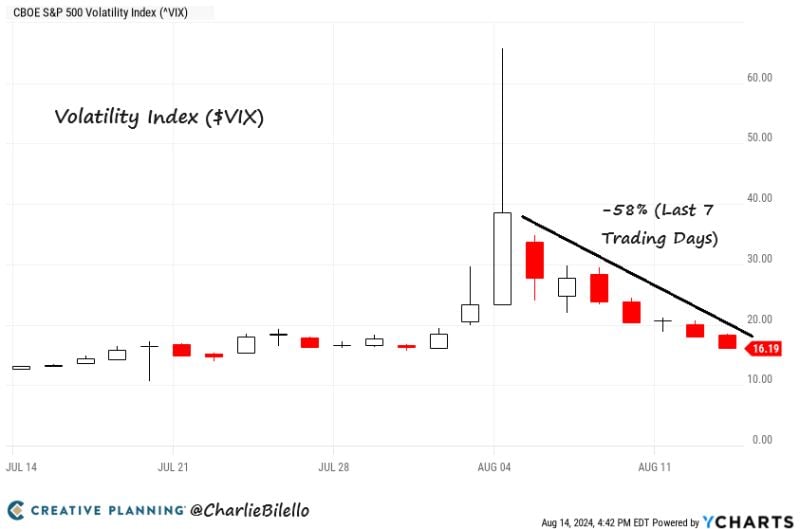
The $VIX has declined 58% (from 38.57 to 16.19) over the last 7 trading days, the biggest 7-day volatility crash in history.
Source: Charlie Bilello
15 Aug 2024
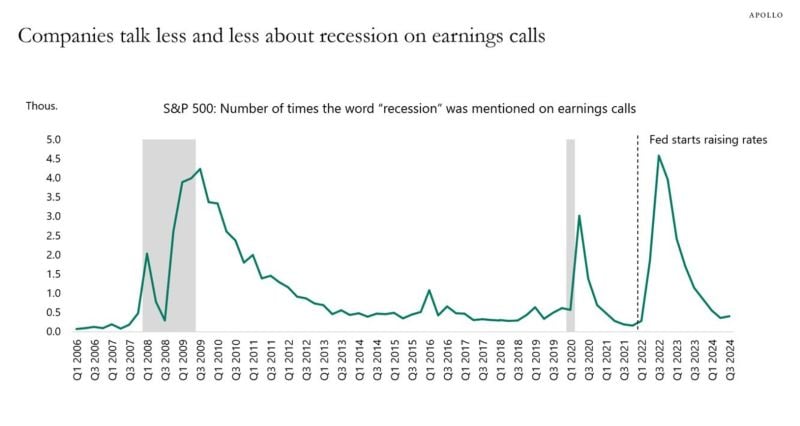
Torsten from Apollo: the reality is that firms on earnings calls talk less and less about recession
Source: Mike Z.
15 Aug 2024
$SBUX Starbucks replaces CEO Laxman Narasimhan with $CMG Chipotle CEO Brian Niccol
$CMG Chipotle's stock is up 773% since Brian Niccol became CEO in March 2018 Just 9 S&P 500 stocks have performed better than $CMG since March 2018 $SBUX must have paid him the star bucks... Source: Stocktwits

13 Aug 2024
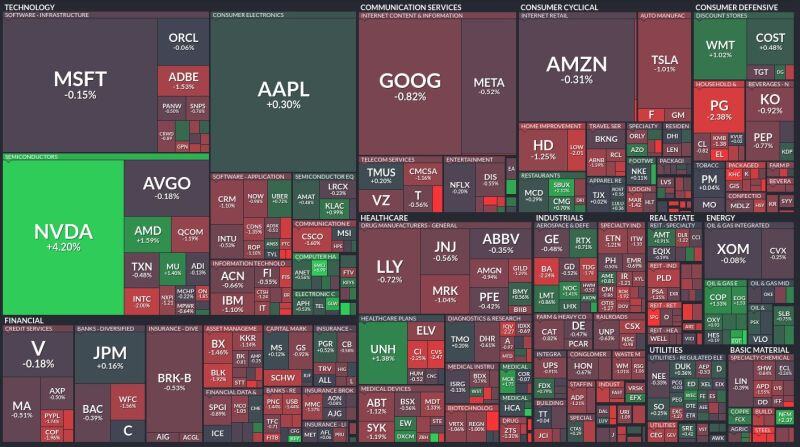
There's the rest of the market .. and then there's $NVDA
Source: Markets & Mayhem
13 Aug 2024
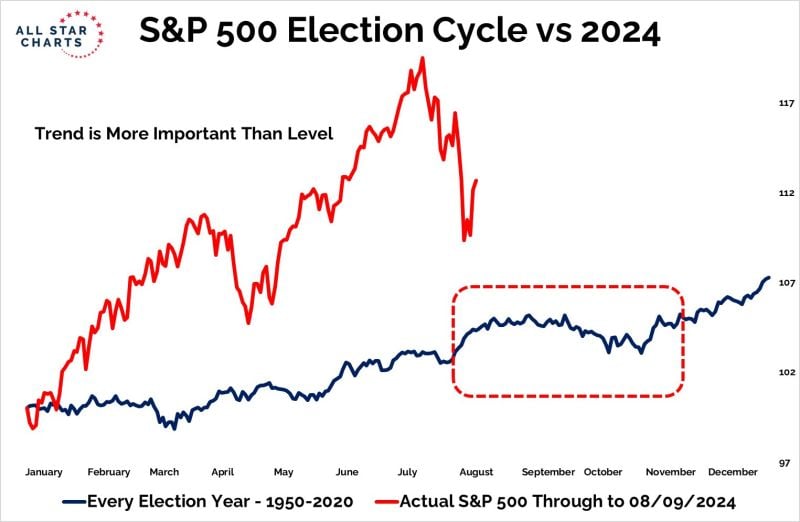
On average with the 4-year cycle... the next few months are sideways at best...
Source: Grant Hawkridge
12 Aug 2024
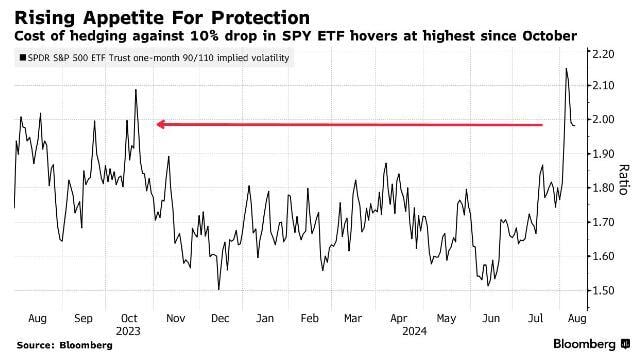
The cost to hedge a 10% drop in the S&P 500 $SPY is hovering at roughly its highest point since October 2023
Source: Bloomberg, Barchart