12 Aug 2024
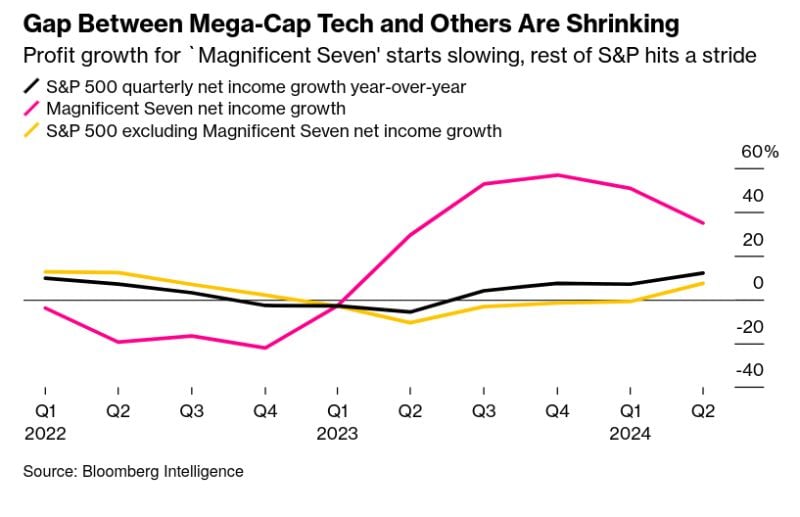
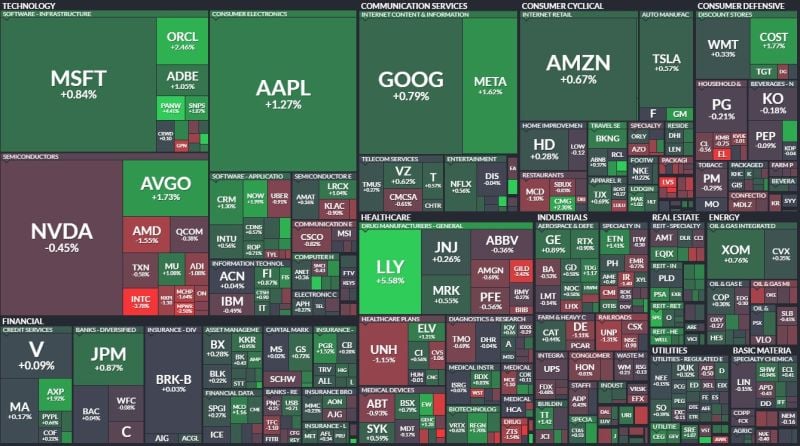
As the Mag 7 slow the rest of the SP500 is showing signs of improving growth
Source: Bloomberg intelligence, Markets & Mayhem
12 Aug 2024
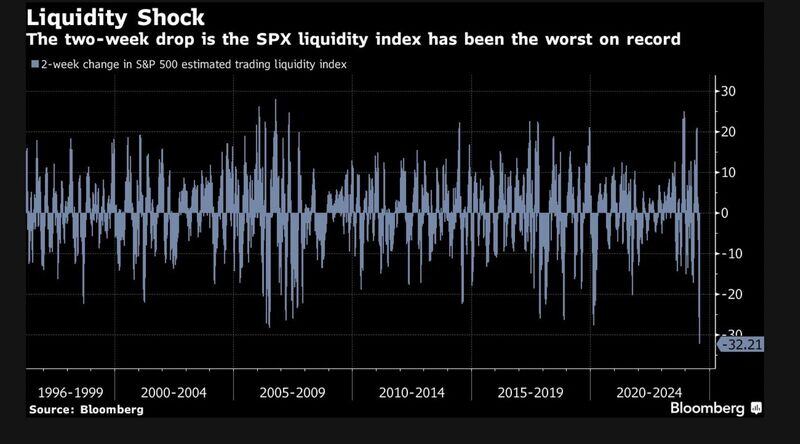
A liquidity shock >>> SPX trading liquidity has collapsed the most on record over 2 weeks
Source: Bloomberg, Alessio Urban
12 Aug 2024
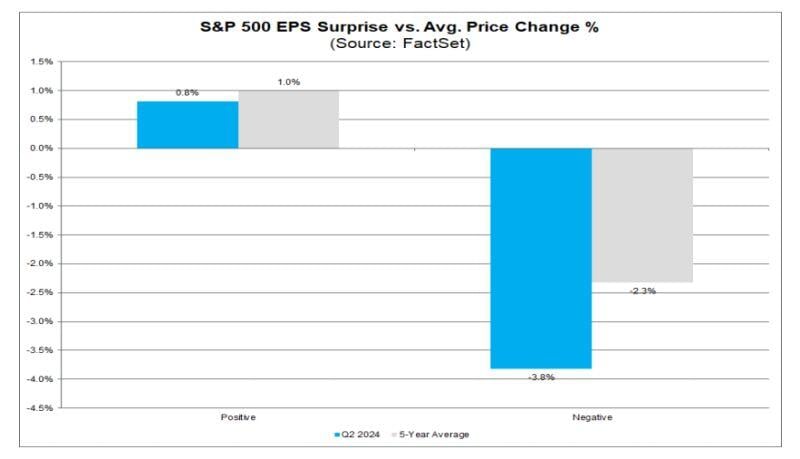
Market Is Punishing Negative EPS Surprises More Than Average for Q2
Source: Factset, Mike Z.
12 Aug 2024
After posting its worst and best day in over a year, the S&P 500 just closed the week down 2 POINTS.
That's a 0.04% decline in a week when the $VIX hit 65... Source: The Kobeissi Letter, Bloomberg
12 Aug 2024
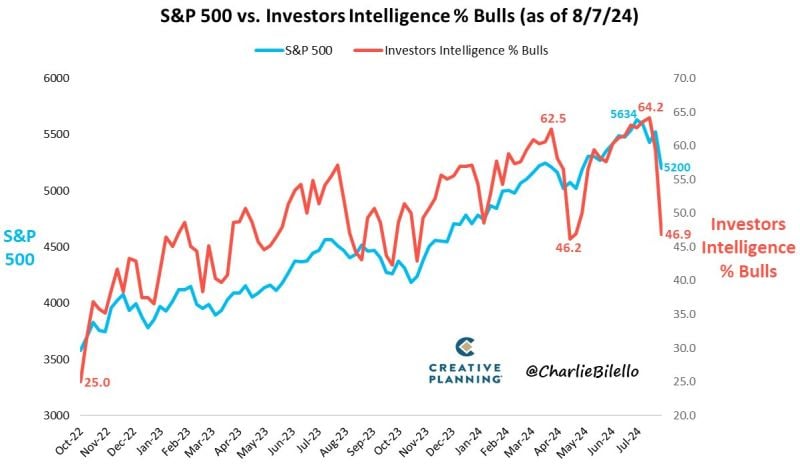
The % of Bulls in the Investors Intelligence Sentiment Index moved down over 17% in the past 2 weeks (from 64.2% to 46.9%)
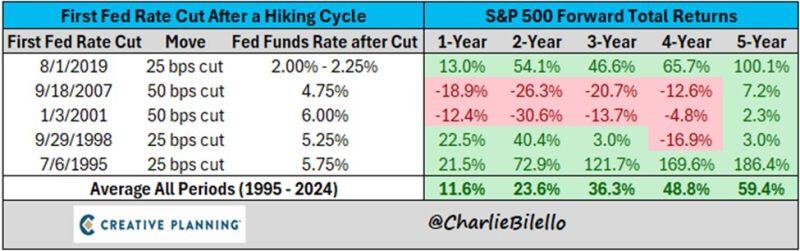
That's the biggest 2-week % drop in Bulls since the October 1987 crash. Source: Charlie Bilello
12 Aug 2024
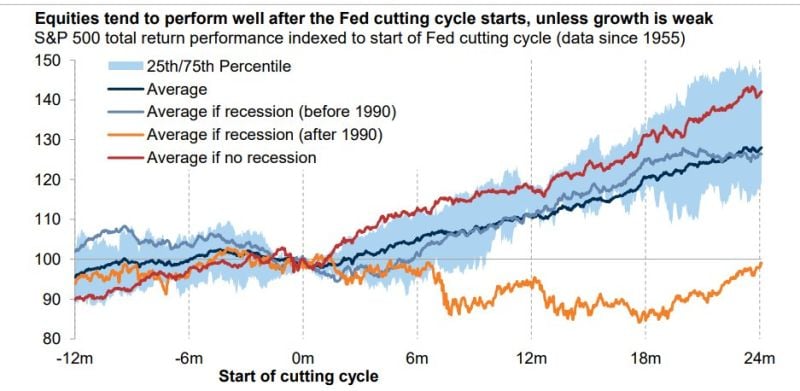
Equities tend to perform well after the Fed cutting cycle starts, unless growth is weak
Source: Goldman Sachs, Mike Z.
12 Aug 2024
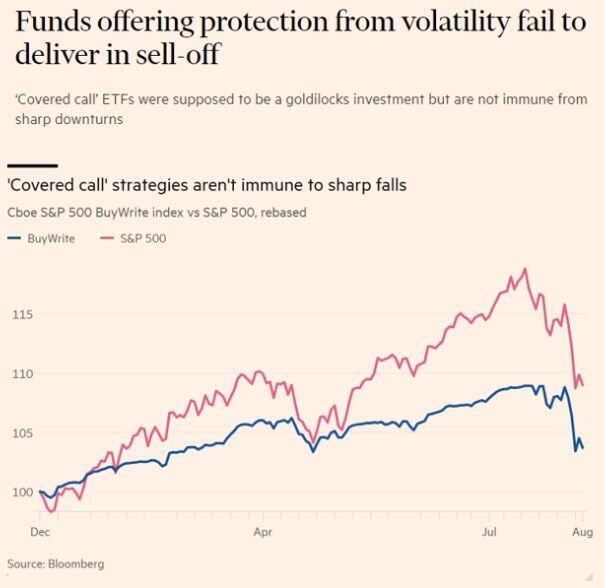
There is no free lunch in finance
Funds designed to protect investors from volatility failed to protect investors during periods of high volatility Source: FT, Barchart
9 Aug 2024
The market is pricing in a 50 basis point rate cut next month.
Market returns following rate cuts have been positive except for periods when the market is generally in crisis. Source: Charlie Bilello, Peter Mallouk