Straight from the Desk
Syz the moment
Live feeds, charts, breaking stories, all day long.
- All
- us
- macro
- equities
- Food for Thoughts
- sp500
- Central banks
- Bonds
- markets
- bitcoin
- Asia
- technical analysis
- investing
- europe
- Crypto
- geopolitics
- performance
- gold
- tech
- Commodities
- AI
- nvidia
- ETF
- earnings
- Forex
- Real Estate
- banking
- oil
- Volatility
- china
- magnificent-7
- nasdaq
- apple
- emerging-markets
- energy
- Alternatives
- switzerland
- trading
- tesla
- sentiment
- russia
- Money Market
- assetmanagement
- UK
- ESG
- Middle East
- amazon
- microsoft
- ethereum
- meta
- bankruptcy
- Turkey
- Healthcare
- Industrial-production
- Global Markets Outlook
- africa
- brics
- Market Outlook
- Asset Allocation Insights
- Flash
- Focus
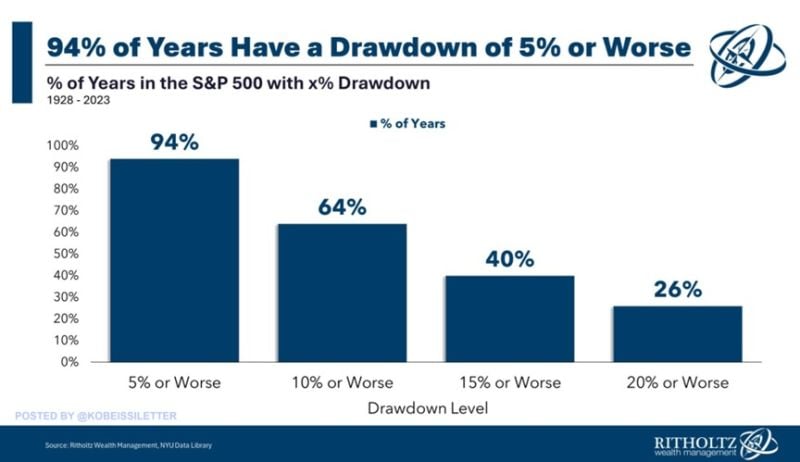
Stock market corrections are a common occurrence: Since 1928, the S&P 500 has experienced a decline of 5% or more in 94% of years.
A correction of 10% or more happened in 61 out of the last 96 years. A larger drawdown of 15%+ was seen in 40% of the years in the 1928-2023 timeframe. Finally, a bear market with a 20% drop or more took place in 25 out of the last 96 years. Stock market pullbacks are normal. Source: Ritholtz Financial, The Kobeissi Letter
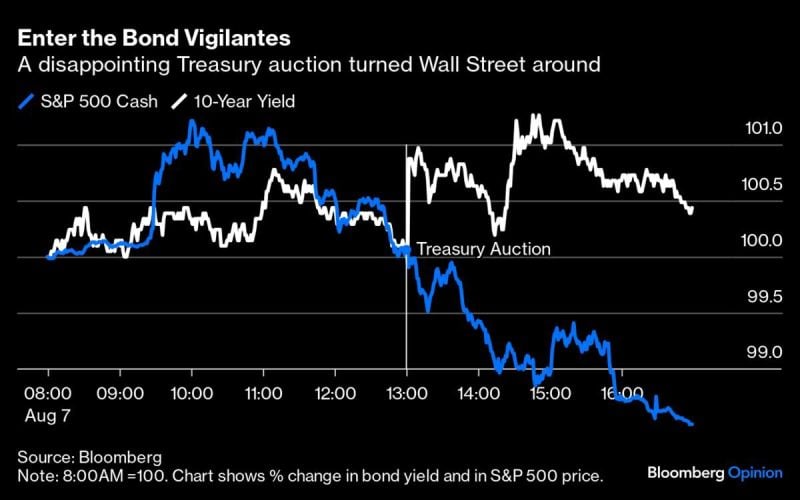
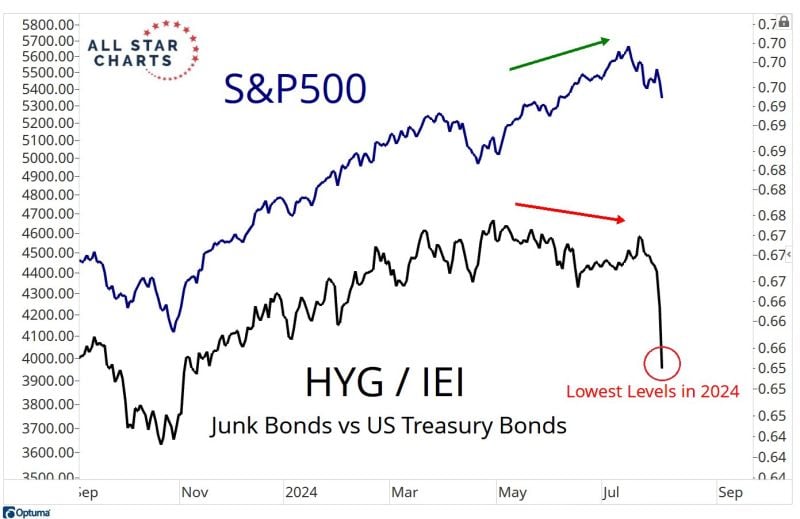
US bond vigilantes managed to turn the stockmarket around.
Investors shunned a $42bn auction of benchmark 10-year US securities, which drew a yield that was well above the pre-sale indicative level. That horrible bond auction pushed stocks lower. Source: Bloomberg, @johnauthers, HolgerZ
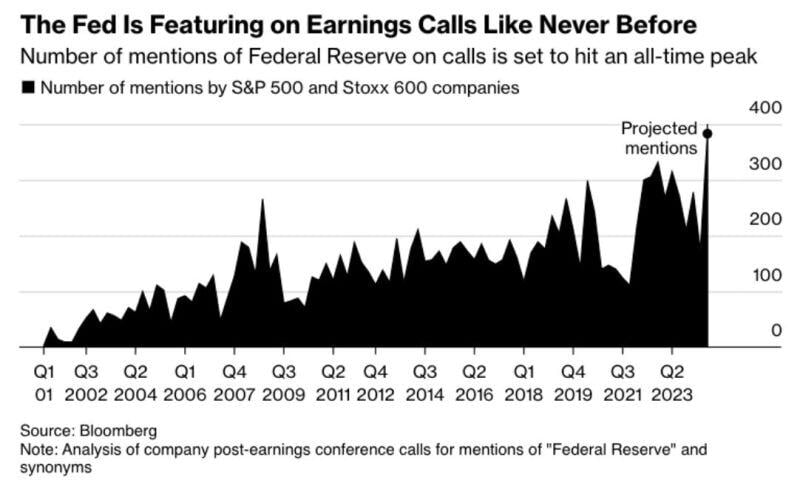
It seems that many companies are in desperate need for rate cuts...
Source: Bloomberg
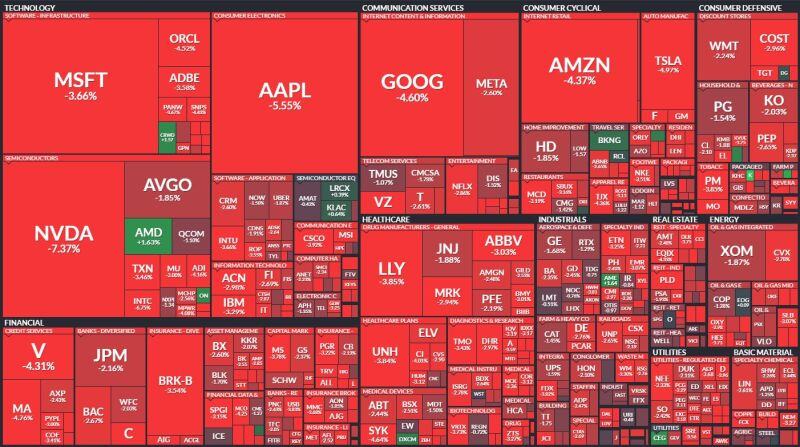
BREAKING: The S&P 500 closes 3.0% lower erasing $1.4 TRILLION of market cap today, posting its worst day since September 2022.
The S&P 500 is now just 1.4% away from correction territory. The Nasdaq 100 is in correction territory and will enter a bear market if it falls 7.5% from current levels. In less than one month, the S&P 500 has erased $5 TRILLION in market cap. Source: The Kobeissi Letter
Volatility is back...
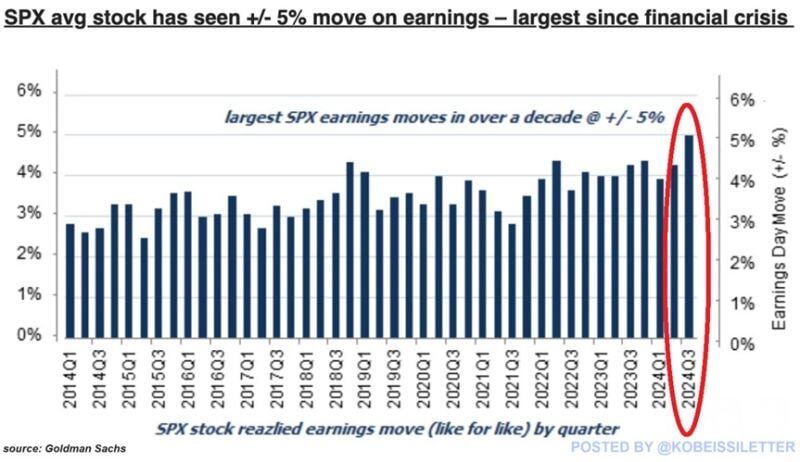
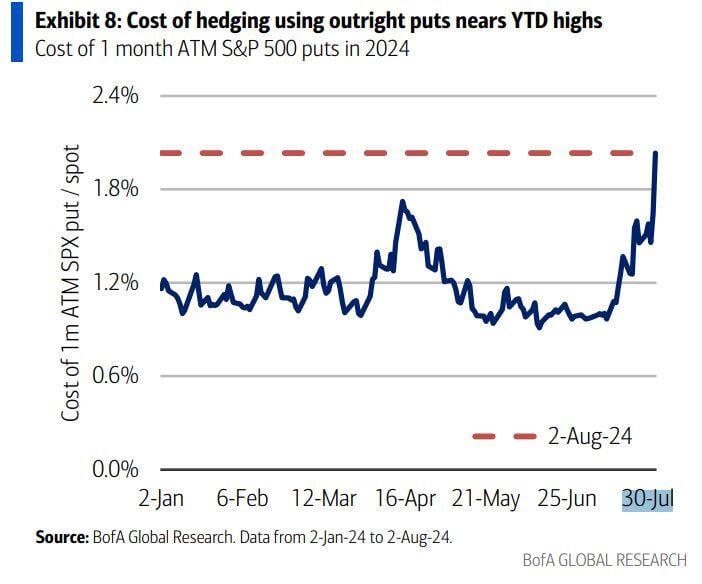
The average S&P 500 stock has seen a 5% one-day move after releasing Q2 2024 earnings. This marks the most volatile earnings season since the 2008 Financial Crisis, according to Goldman Sachs. By comparison, in Q1 2024 and Q4 2023, the average stock moved by ~4% one day after the release. The volatility index, $VIX, is now up ~95% over the last month alone. Volatility is opportunity for traders. Source: The Kobeissi Letter
Investing with intelligence
Our latest research, commentary and market outlooks


