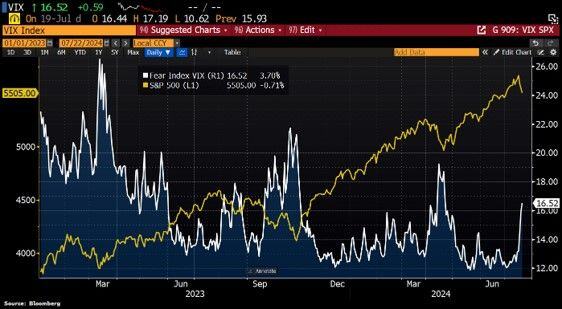
The end of complacency? Fear Index Vix has jumped 32.6% last week, the biggest weekly increase since March 2023.
But at 16.5, the Vix level is still below the long-term average of 19.8. And remember that during election years, volatility tends to increase by 25% between July and November... Source: HolgerZ, Bloomberg
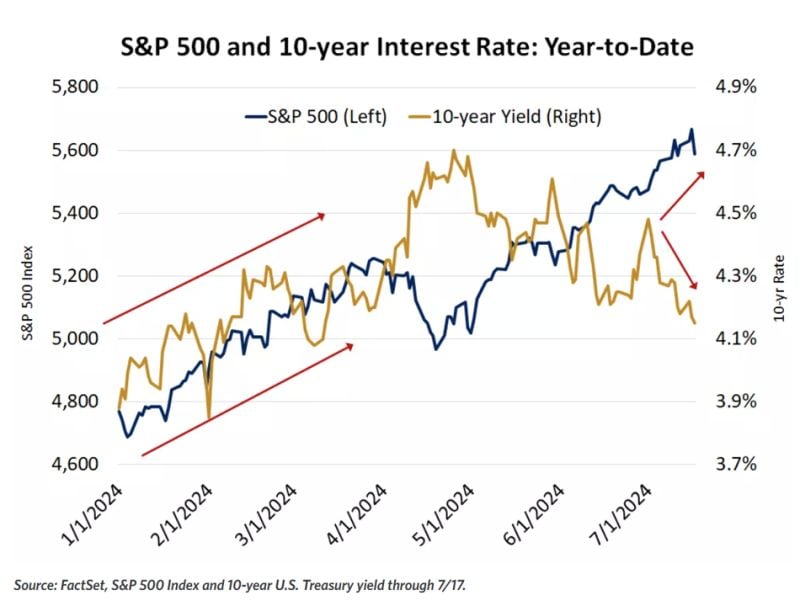
This is not a Trump trade but rather a "soft landing trade" => Stocks have rallied on the prospects of a soft landing for the economy
Source: Edward Jones
 Stocks have rallied on the prospects of a soft landing for the economy">
Stocks have rallied on the prospects of a soft landing for the economy">
Stocks have rallied on the prospects of a soft landing for the economy">
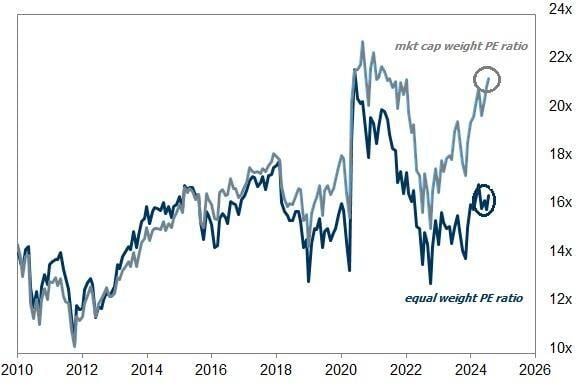
Equal weight S&P 500 (ETF $RSP) is considerably cheaper than the market cap weighted ETF, just as we may see earnings growth broaden out to a wider swath of companies.
Does that spell opportunity? Source: Markets & Mayhem, GS
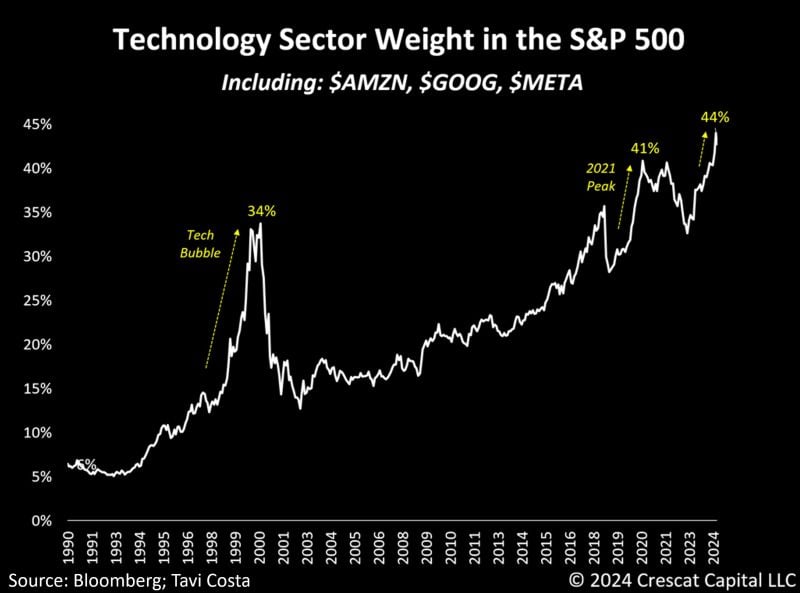
Meanwhile: The tech sector now represents 44% of the S&P 500 index when including Amazon, Alphabet, and Meta.
The pendulum has probably swung too far in one direction, and investors are running out of ideas to justify these historical distortions. Source: Tavi Costa, Bloomberg
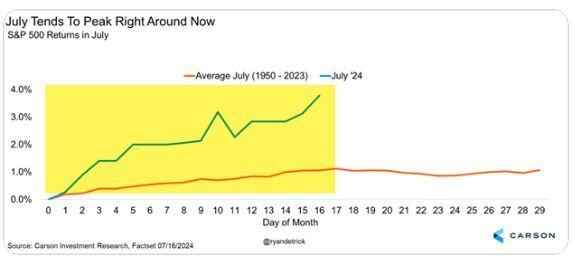
July has been up 9 years in a row and the first half of July is one of the strongest periods of the year.
This strength shouldn't be too surprising. But be aware historically July peaks on the 17th, so tomorrow. Source: Ryan Detrick
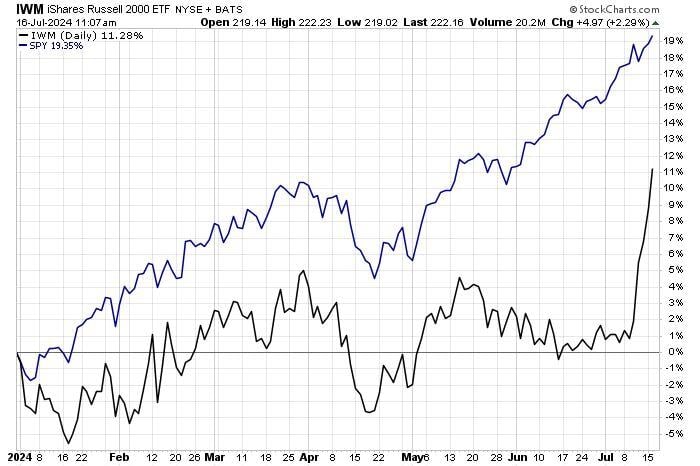
Russell 2000 $IWM is catching up with S&P500...
Russell 2000 is now up +11.3% YTD (with 10.3ppt has come in the last 5 sessions...) versus + for S£P 500 +19.35% YTD Source: Mike Zaccardi
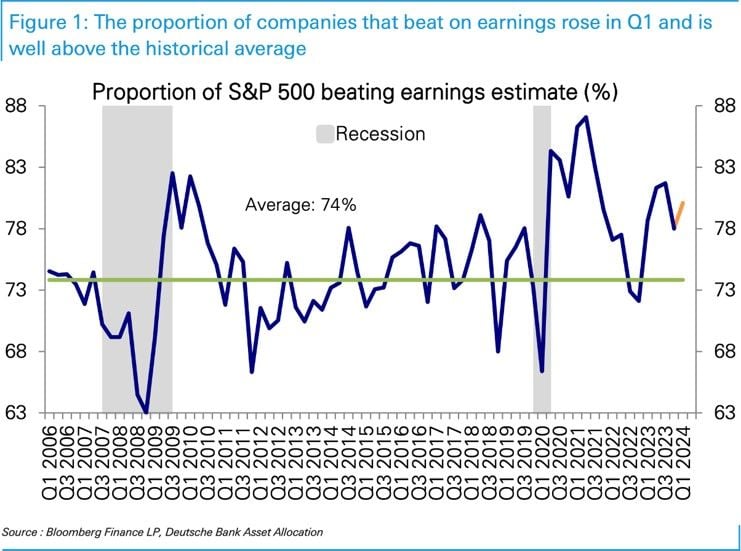
As we get into the heat of EPS season...
DB notes that more companies have been beating and by a larger amount in recent quarters. If this continues, it is tough to bet against this market... Source: Deutsche Bank, RBC
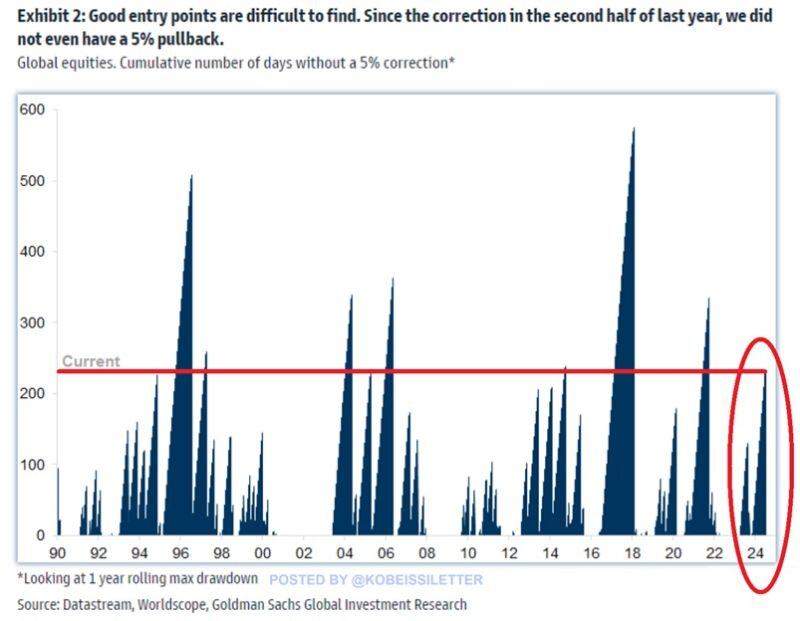
It has now been over 220 days without a 5% pullback in the S&P 500, the 3rd longest streak in the last 10 years.
The last time a 5% correction occurred was in the second half of 2023. Overall, over the last 34 years, the longest stretch lasted for ~550 days in 2016-2018. Meanwhile, the S&P 500 has skyrocketed by 33% since October and 15% year-to-date in one of its best rallies in years. Source: The Kobeissi Letter, Goldman Sachs