Straight from the Desk
Syz the moment
Live feeds, charts, breaking stories, all day long.
- All
- us
- macro
- equities
- Food for Thoughts
- sp500
- Central banks
- Bonds
- markets
- bitcoin
- Asia
- technical analysis
- investing
- europe
- Crypto
- geopolitics
- performance
- tech
- gold
- Commodities
- AI
- nvidia
- ETF
- earnings
- Forex
- Real Estate
- oil
- banking
- Volatility
- magnificent-7
- nasdaq
- apple
- china
- emerging-markets
- energy
- Alternatives
- switzerland
- trading
- tesla
- sentiment
- russia
- Money Market
- assetmanagement
- UK
- ESG
- Middle East
- microsoft
- amazon
- ethereum
- meta
- bankruptcy
- Turkey
- Healthcare
- Industrial-production
- Global Markets Outlook
- africa
- brics
- Market Outlook
- Asset Allocation Insights
- Flash
- Focus
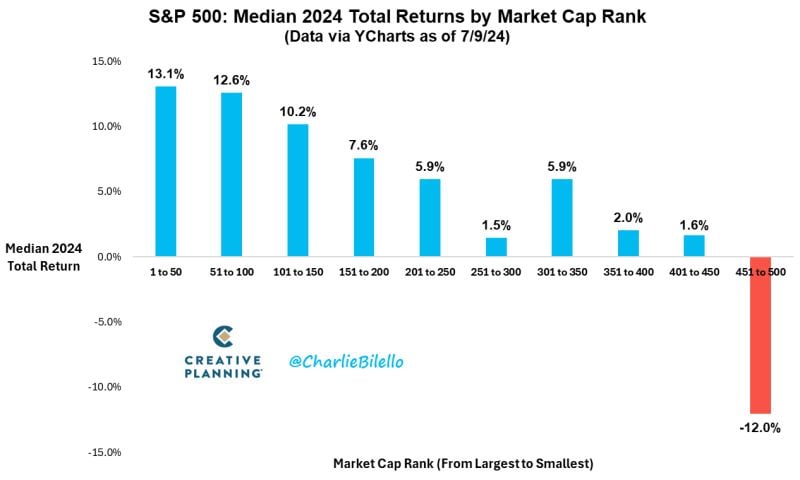
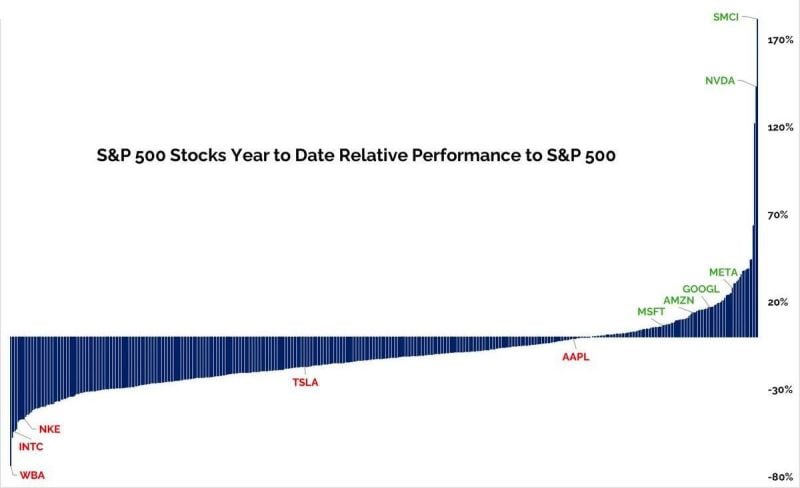
The 50 largest stocks in the S&P500 have a median return of +13% this year while the 50 smallest stocks in the index are down 12%.
$SPX Source: Charlie Bilello
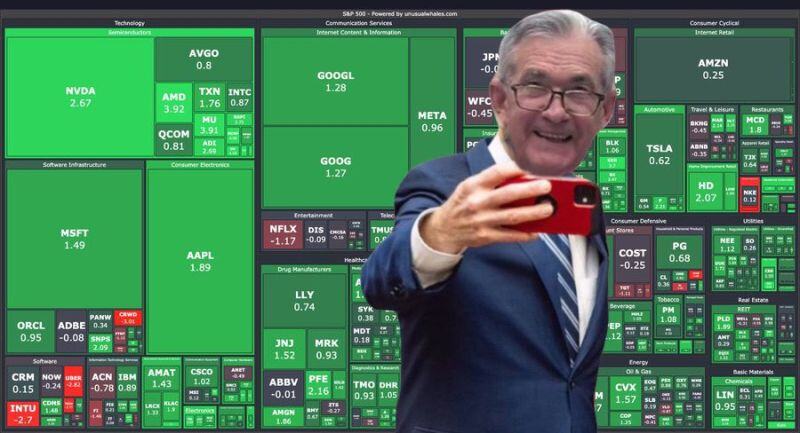
The S&P 500 climbed Wednesday to a fresh record, breaking above 5,600 for the first time, as a sharp rise in semiconductor stocks led the market higher.
The broad market index jumped 1.02%, closing at 5,633.91, and notching a seventh straight day of gains.
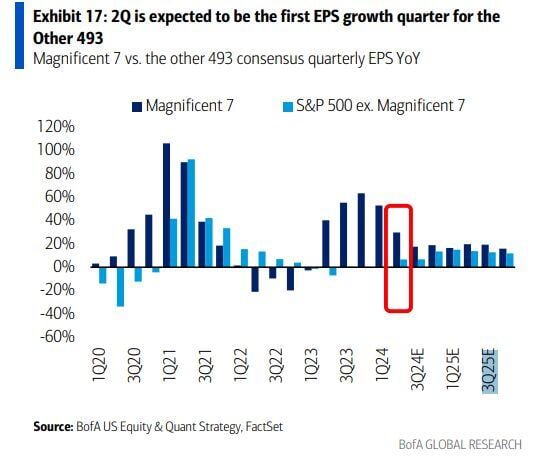
The S&P 493 earnings have been flat to down for the past five quarters.
2Q is expected to mark the first growth quarter for the Other 493. Could it lead to a more balanced market? Source: BofA
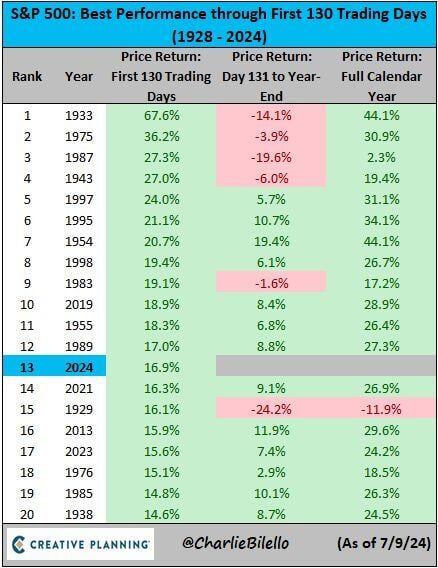
The S&P 500 is up 16.9% in 2024, the 13th best start to a year going back to 1928 and the best start to a presidential election year in history.
$SPX Source: Charlie Bilello
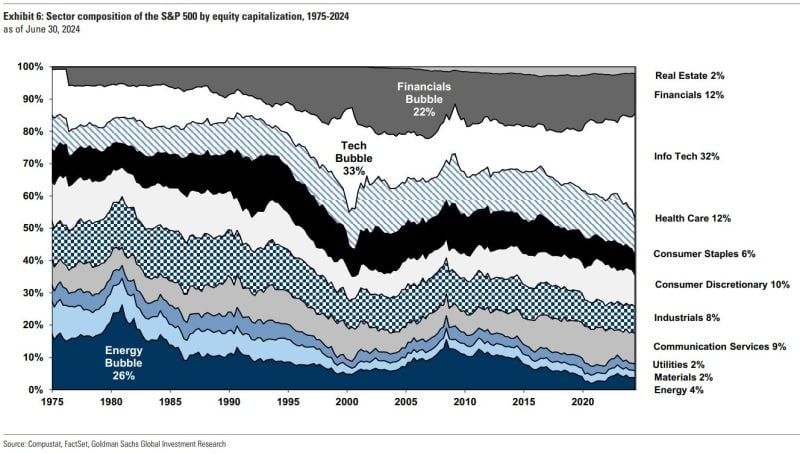
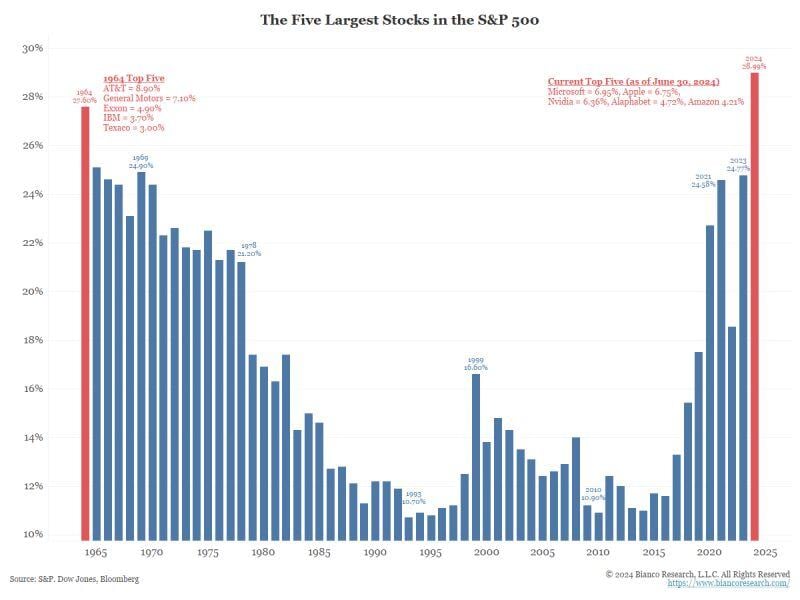
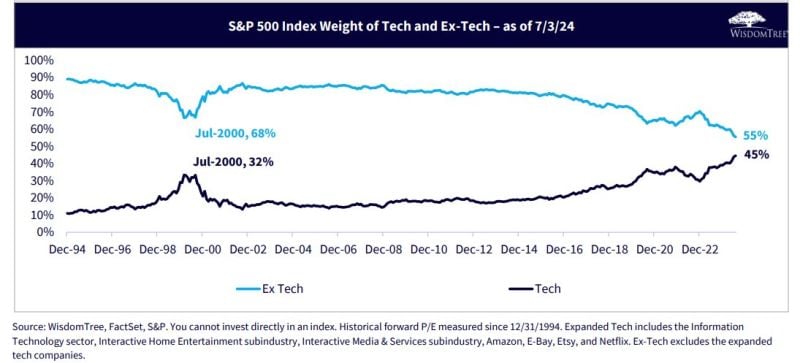
S&P500 concentration at the highest level in at least 60 years: 5 largest stocks within S&P 500 = 28.99%
As mentioned by Jim Bianco: The risk of the current S&P500 concentration is that one day the opposite happens: five stocks could kill the index funds while everything else outperforms... "Restated, one buys an index fund to get diversification. But with record concentration, they are not getting it". Source: Bianco Research
Investing with intelligence
Our latest research, commentary and market outlooks

