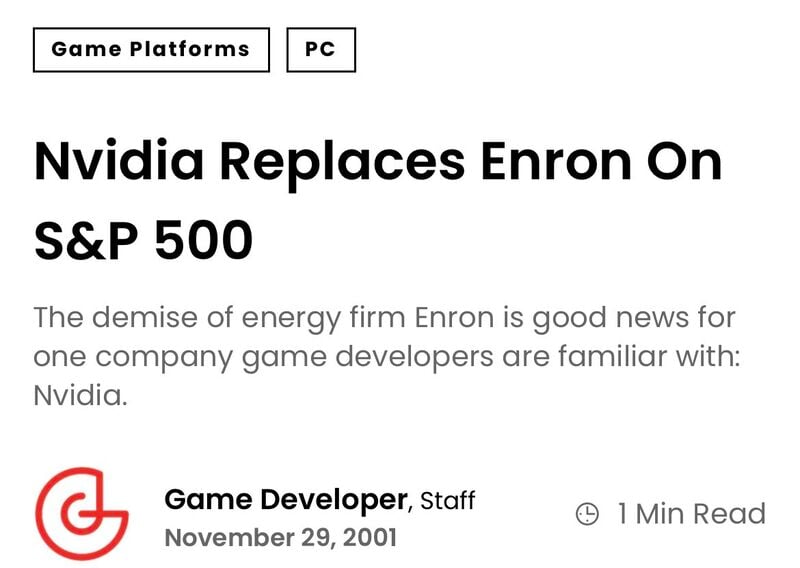
Almost 23 years ago, Standard & Poor's selected Nvidia to replace the departing Enron in the S&P 500 stock index...
Source: Michel A.Arouet
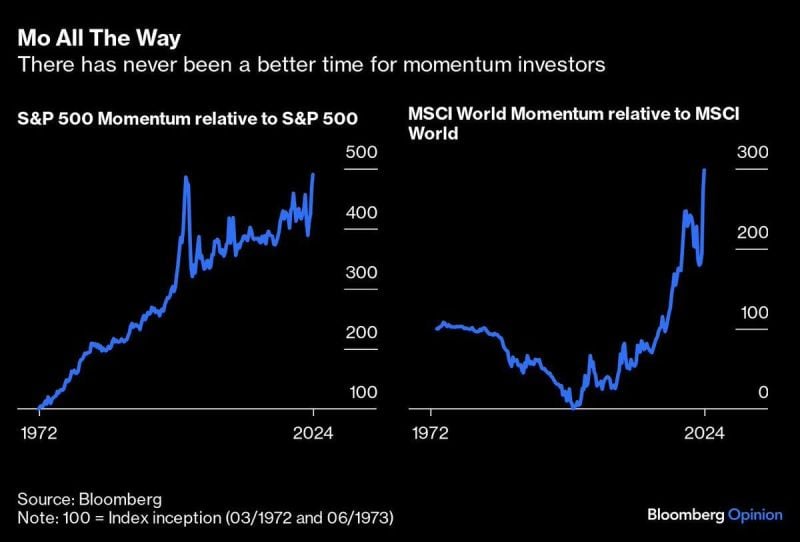
Momentum Trading is having the most success in history, even surpassing the Dot Com Bubble
Source: Barchart, Bloomberg
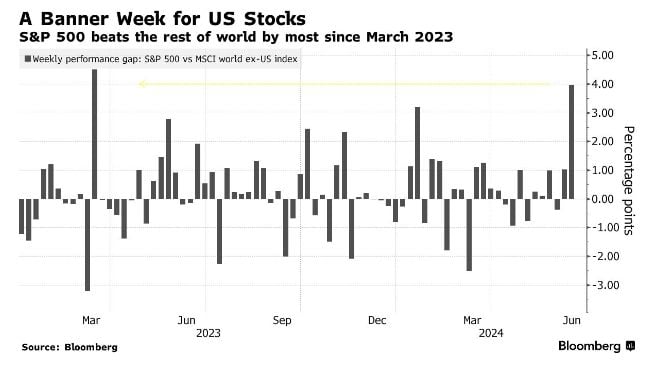
S&P 500 $SPX outperformed Global Stocks this week by the largest margin in 15 months...
Source: Barchart, Bloomberg
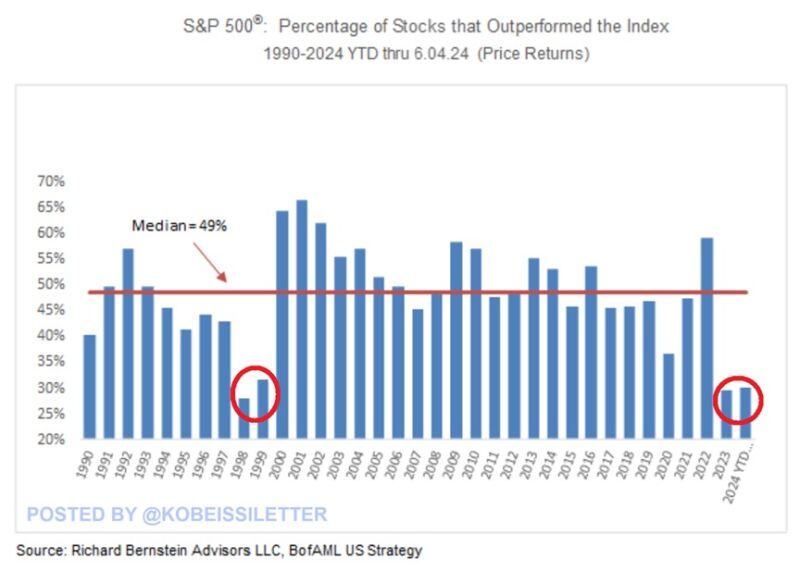
Only 30% of the SP500 stocks have outperformed the index year-to-date.
This is slightly higher than the 29% that occurred in 2023. Since 1990, a streak of 2 consecutive years with such a low percentage has happened only during the 2000 Dot-com bubble. By comparison, the historic median is 49% which typically implied healthy market breadth. The S&P 500 has rallied 12% year-to-date largely driven by just a few tech stocks. A few stocks are driving the entire market. Source: The Kobeissi Letter, Richard Bernstein Advisors
The Magnificent 7's share of the SP500 just hit another all-time high of 32%.
This is 12 percentage points higher than at the beginning of 2023. The weight of these 7 stocks in the index has almost DOUBLED in just over 4 years. This comes as the 3 largest stocks, Apple, Microsoft, and Nvidia, are all officially worth over $3 trillion. Meanwhile, the technology sector just hit another all-time high relative to the S&P 500. Tech is becoming even more dominant. Source: Bloomberg, The Kobeissi Letter

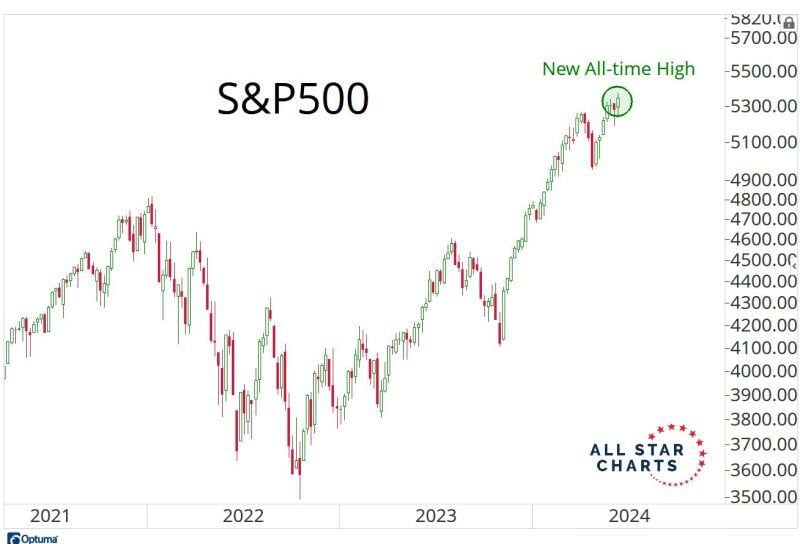
The SP500 closed the week at new all-time highs.
And a whopping 33 stocks on the NYSE closed at new highs. That's only 1.4% of stocks on the most important exchange in the world hitting new highs. Source: J.C. Parets @allstarcharts
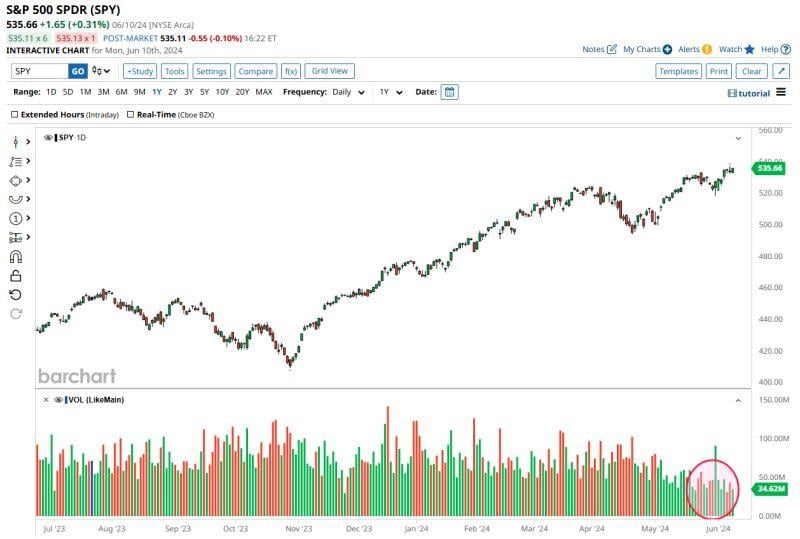
S&P 500 continues to hit record highs on EXTREMELY low volume.
Today was the 4th lowest volume day of the year for $SPY. Three of this year's four lowest volume days have come in the last week. All 4 of the lowest volume days have come in the last 3 weeks. Source: Barchart
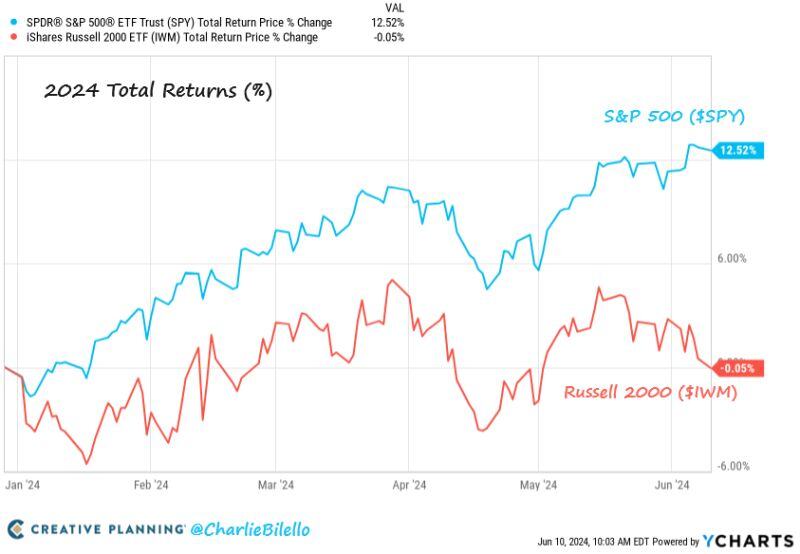
Small cap stocks are now down on the year while Large caps are still up 12.5%. $SPY $IWM
Source: Charlie Bilello