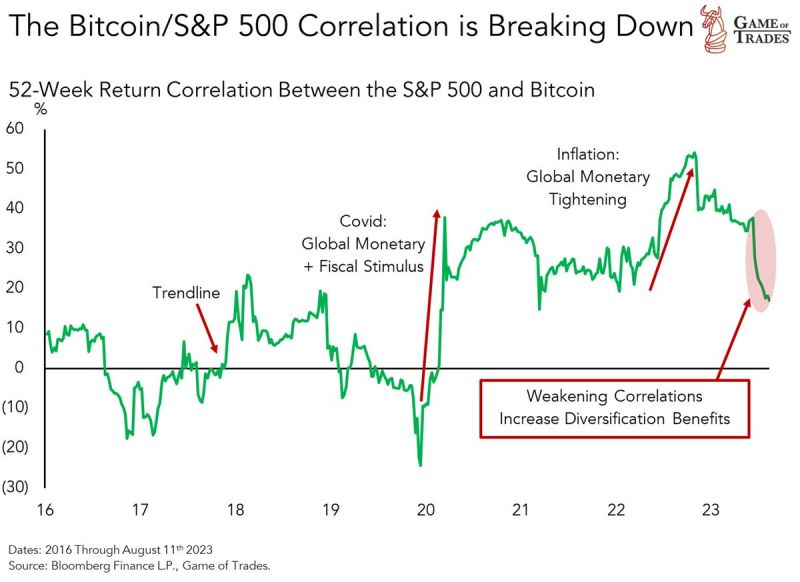
Bitcoin's correlation to the sp500 has shown signs of breaking down Lower correlation boosts BTC's diversification potential
Source: Game of trades
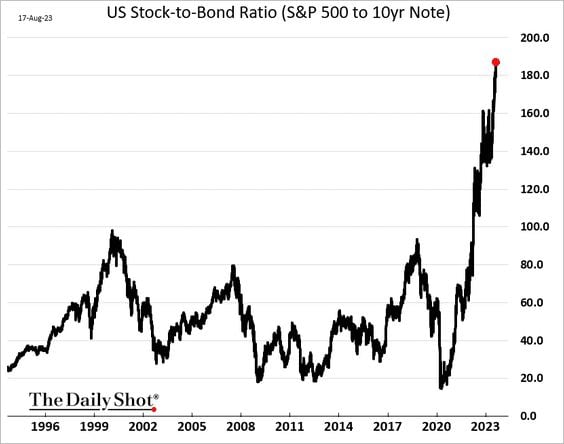
S&P 500 to 10-year note ratio is going parabolic
Source: barchart, The Daily Shot
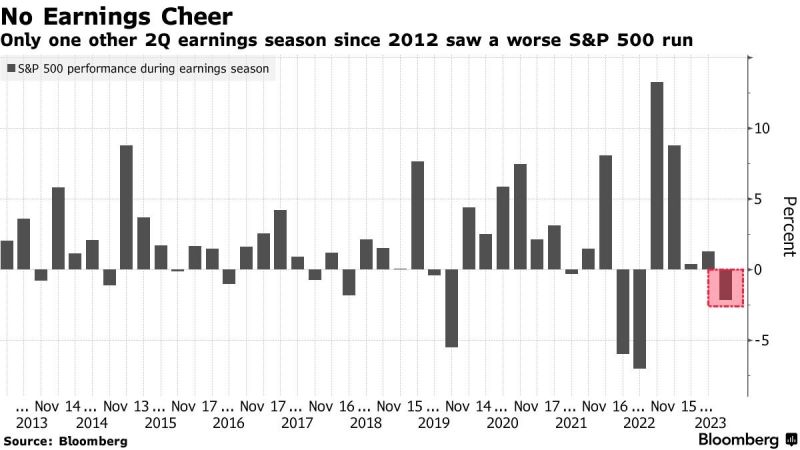
More than 80% of SP500 companies that have reported so far have beaten profit expectations but the returns are setting this up to be one of the worst earnings seasons over the last 11 years
Source: Bloomberg
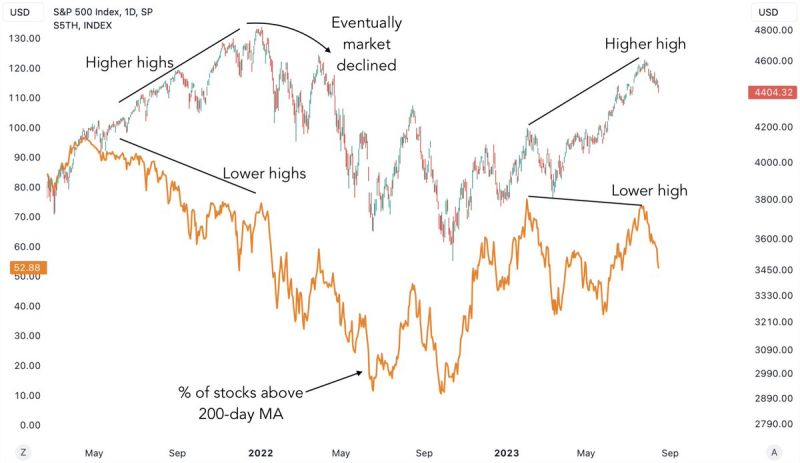
There is bearish divergence spotted between the market (SP500) and % of stocks above their 200-day MA
The last occurrence led to significant downside for equities. Source: Game of Trades
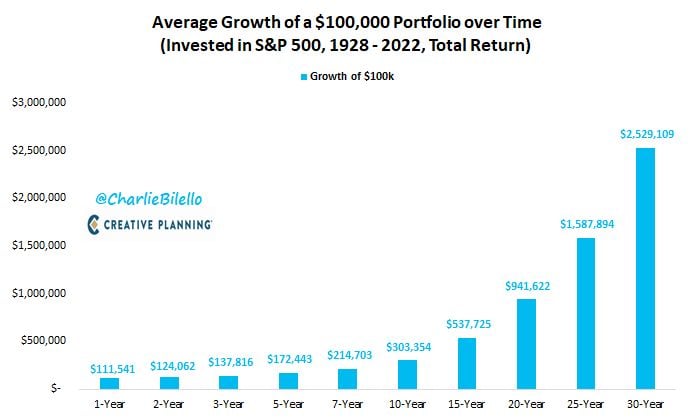
The biggest money in investing comes from patience and time
Your biggest edge as an individual investor comes from ignoring short-term fluctuations and playing the long game. Source: Peter Mallouk, Charlie Bilello
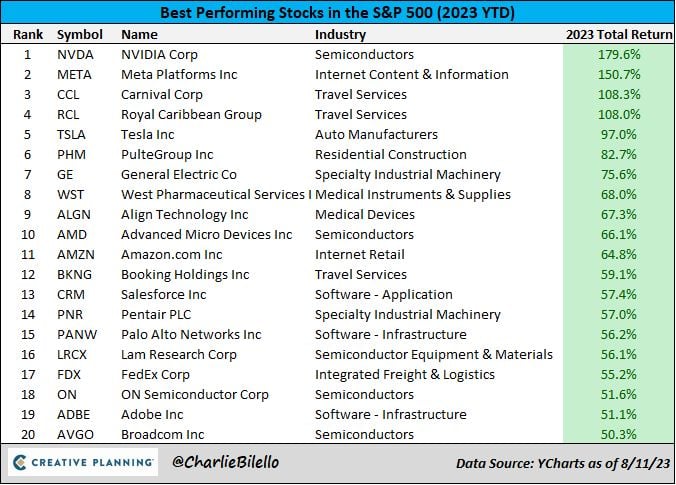
The best performance stocks in the S&P 500 this year...
Source: Charlie Bilello
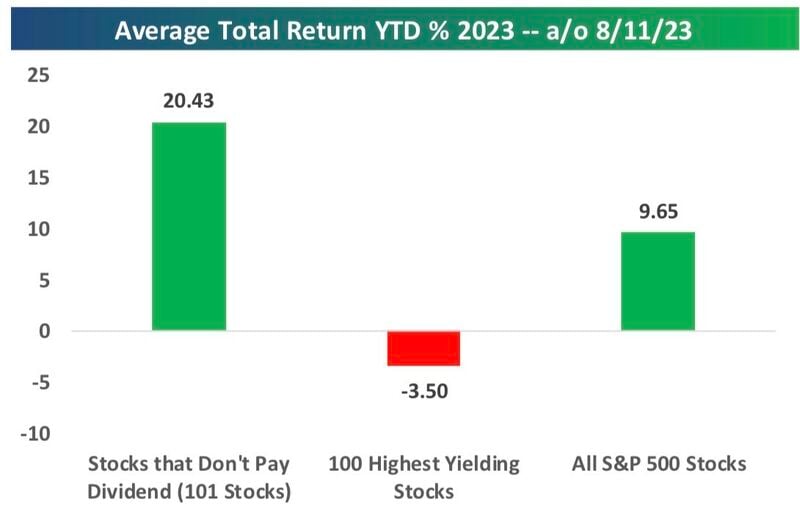
With “risk free” rates above 5%, the typically low-growth, high-dividend payers in the sp500 are massively underperforming in 2023
The 101 non-dividend payers are up 20.4% YTD, while the 100 highest yielders in the index are down an average of 3.5% on a total return basis. Source: Bespoke
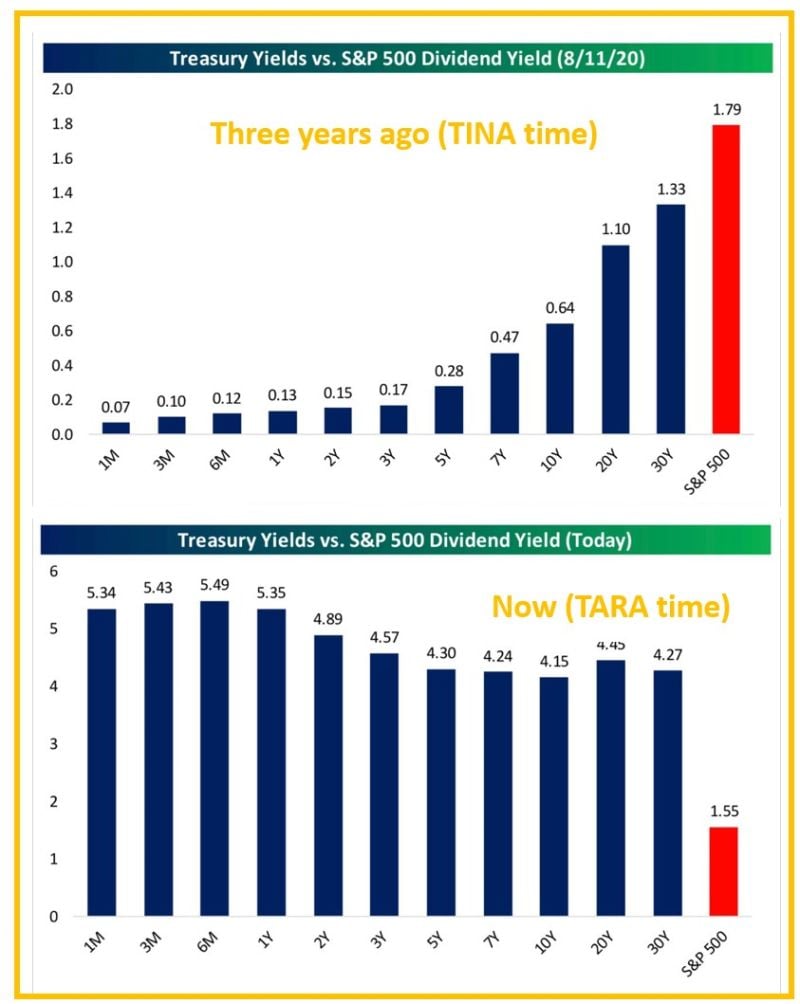
From T.I.N.A (There is No Alternatives to risk assets) to T.A.R.A (There Are Reasonable Alternatives, i.e bonds)
Three years ago in August 2020, the S&P’s dividend yield (in red below) was 1.8%, almost 50 bps higher than the highest yield on the treasury curve. Every treasury note with a duration shorter than 5 years had a yield below 0.2% and the 1-month was almost ZERO. Fast forward to today and the S&P’s dividend yield of 1.55% is 260 bps lower than the lowest point on the treasury curve right now (the 10-year at 4.15%). And the 1-month T-bill yielding at 5.34% is 380 basis points higher than the S&P’s dividend yield. Source: Bespoke