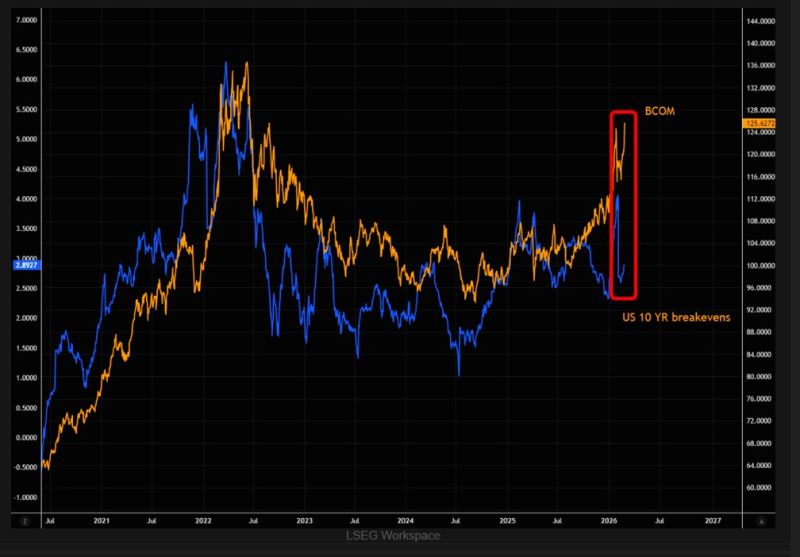
Bloomberg Commodity index $BCOM vs. US 10-year breakevens is now trading with a massive gap
A divergence we rarely see. Source: TME, LSEG
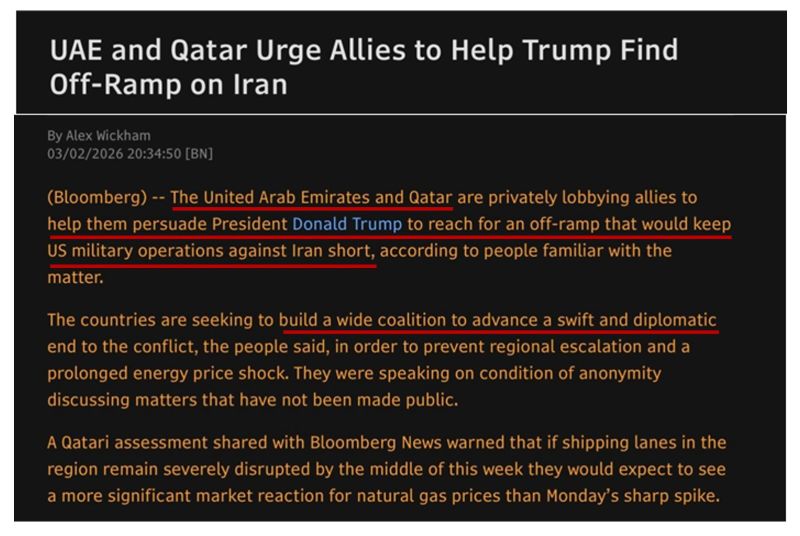
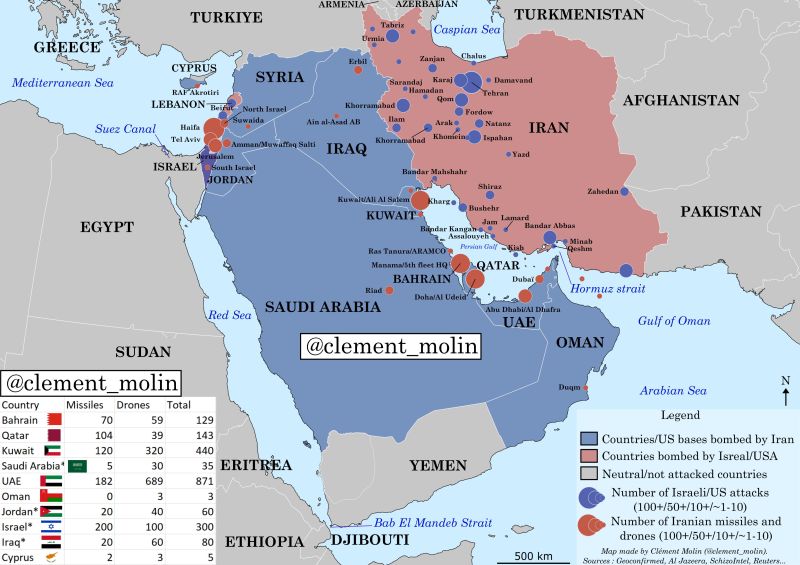
Is Iran’s strategy already working?
Source. Bloomberg
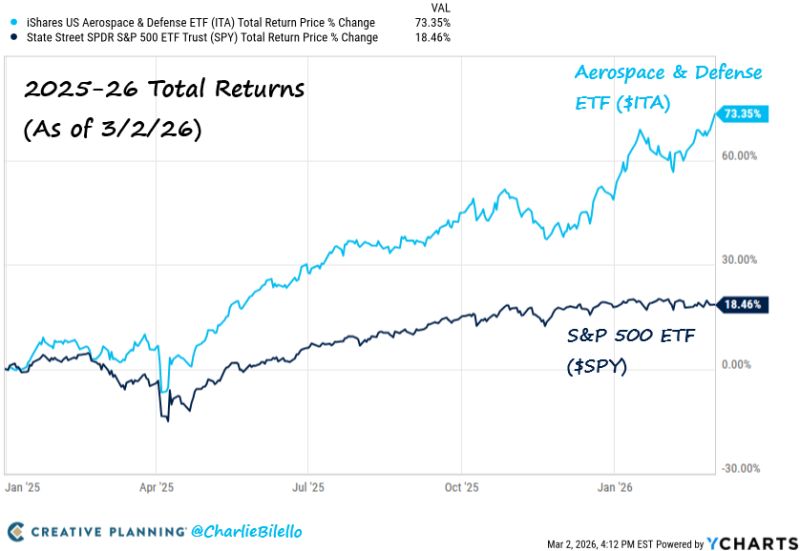
Best defense is defense...
Source: Charlie Bilello
Day 4. Middle East.
As expected, there is some escalation as the war between the U.S. + Israel and Iran is intensifying. Here’s what changed in the last 24 hours: ✈️ Air Superiority Established US and Israeli air forces now hold near-total air control over Iran. Dozens of missile launchers, rear bases, and command centers were hit — especially in Tehran. 🎯 But Iran is far from neutralized Iran continues launching drones and missiles across the region. Some reached critical U.S. bases. Now the conflict has expanded geographically: • Hezbollah joined the fight from Lebanon • Israeli airstrikes followed inside Lebanon • Iranian strikes hit Saudi Arabia (including Ras Tanura / ARAMCO refinery) • US Embassy in Riyadh targeted • Ongoing strikes across Iraq, Kuwait, Bahrain, Qatar, UAE, Jordan, Cyprus, and Israel ⚠️ Notably: 3 American F-16s were reportedly shot down in Kuwait — by error. The Regional Fallout • Protests erupted around U.S. embassies in Iraq and Bahrain • The U.S. has called on all American citizens to leave the region • 20 U.S. cargo aircraft are en route to reinforce logistics and defense systems Strategic Questions Now Emerging ▫️ Despite 4 days of heavy bombardment, the Iranian regime remains intact ▫️ Iranian counter-strikes continue — but how deep are their missile stocks? ▫️ Gulf countries and Israel may soon face air-defense missile shortages This is no longer a contained confrontation. It’s a multi-front regional escalation with air dominance on one side and missile saturation strategy on the other. The coming days will likely determine whether this stabilizes… or spreads further. Source: @Clément Molin on X
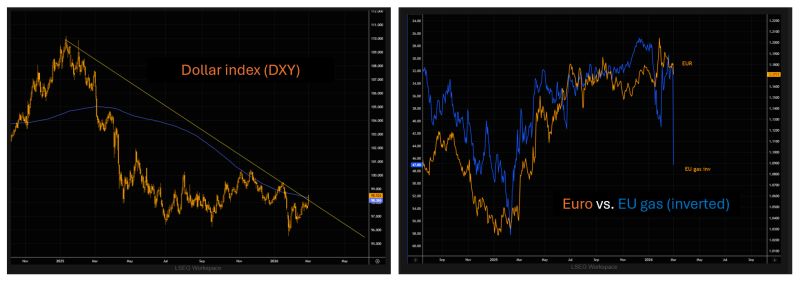
The dollar index $DXY is now flirting with the downtrend line that has been in place since early 2025 (chart on the left).
It is breaking above the 200-day moving average. A close slightly higher from here, and we could be staring at a proper dollar squeeze. Meanwhile, the EUR has tracked EU gas almost perfectly, and the gap now is massive. The chart on the right shows EUR versus EU gas (inverted). That gap is huge. Source: The Market Ear, LSEG
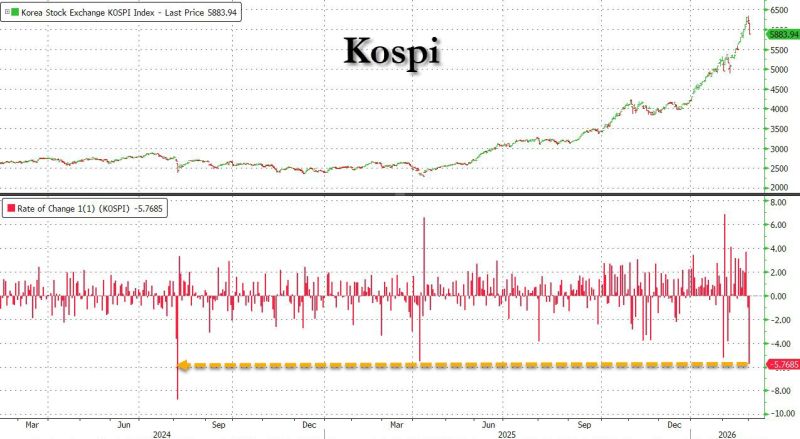
Kospi -6%, bigger drop than Liberation day, worst day since August 2024 carry trade unwind
Source: www.zerohedge.com, Bloomberg
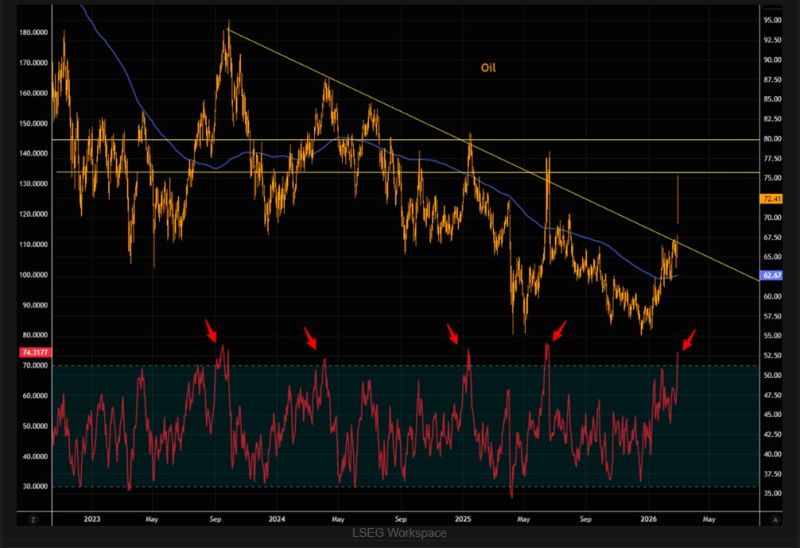
Chasing overbought oil is usually a bad trade.
Source: TME, LSEG
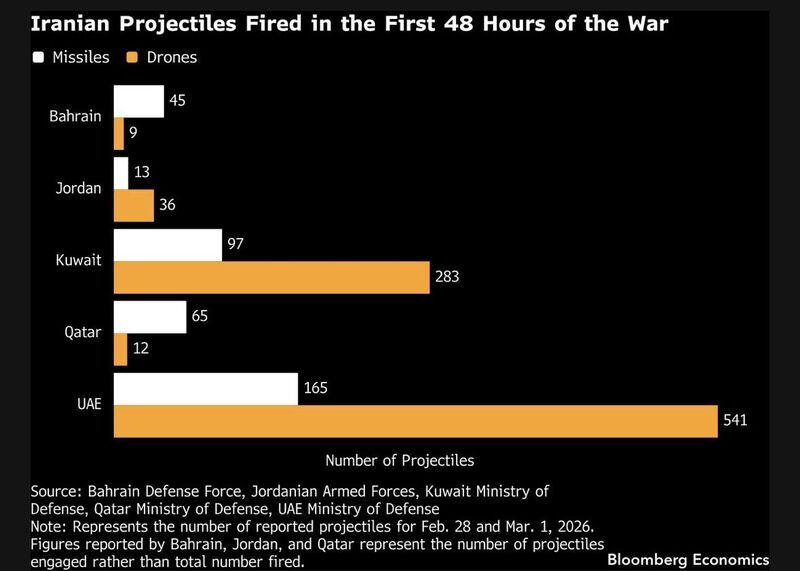
Iran fired 1200+ projectiles at five countries in the first 48 hours.
Most were drones. These saturation attacks aim to overwhelm air defenses and drain interceptors. $20-50k Shahed drones vs. $4.19M PAC-3 interceptors put US and its partners on the wrong side of the cost curve. Source: Bloomberg, Becca Wasser