THIS WEEK COULD RESHAPE THE FUTURE OF CRYPTO.
Two major structural catalysts are approaching. • Monday: The Senate returns, and the CLARITY Act enters its final push before the August recess. If passed, it would split crypto oversight between the CFTC and SEC, protect DeFi developers, and permanently ban a federal CBDC. • Wednesday: DTCC targets its first limited production tokenization trades. The firm behind $114T+ in cleared assets is bringing stocks, ETFs, and Treasuries on-chain with backing from BlackRock, Goldman Sachs, JPMorgan, and Citi. Regulatory clarity. Institutional tokenization. Both converging in the same week. Source: Crypto Rover
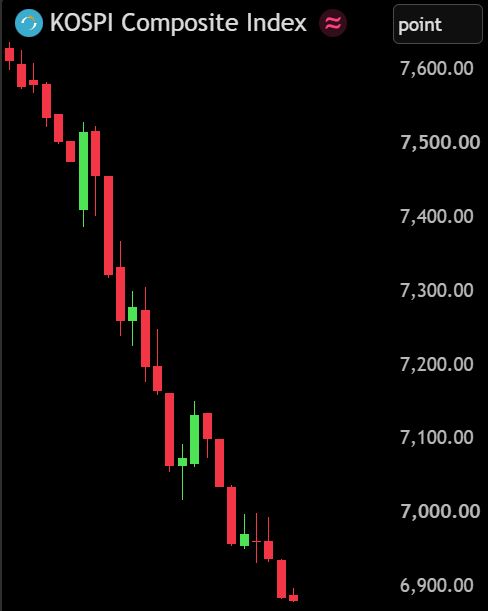
South Korea's KOSPI stock market trading has been halted for 20 minutes after crashing -8%.
Over ₩488,000,000,000,000 ($328 BILLION) has been wiped out from South Korean stocks today. Source: Bull Theory
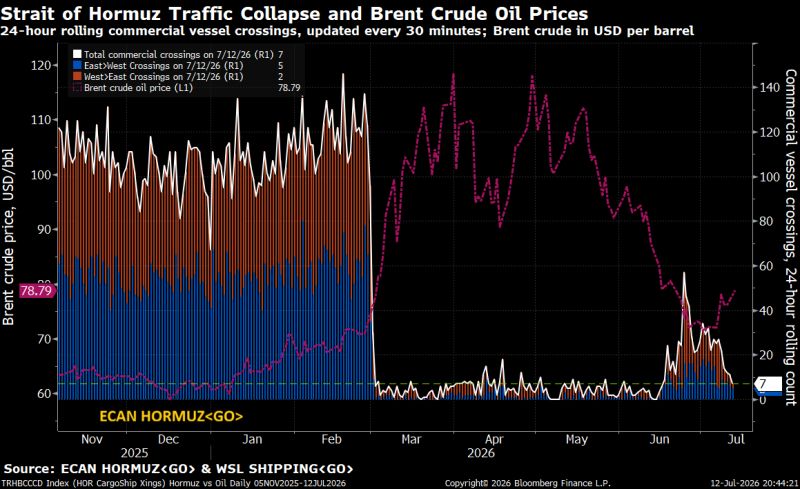
Update (7/12 PM): The tape keeps thinning
7 commercial crossings in the last 24h (5 E→W / 2 W→E), down from 11 yesterday and barely ~6% of the Jan–Feb run-rate. Brent's grinding higher, ~$78.79 and climbing as the closure prices in. Flow down, crude up Source: @TheTerminal Michael McDonough
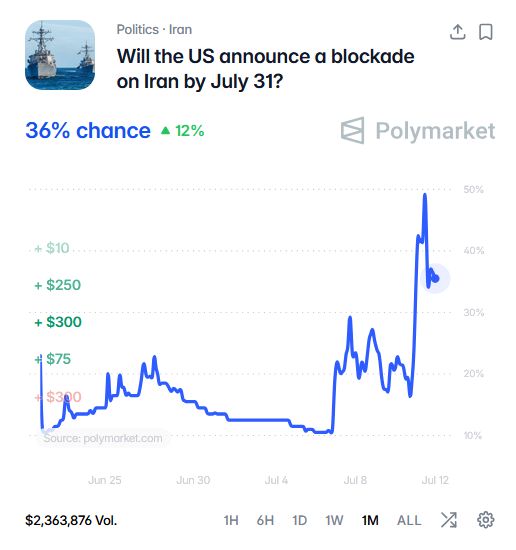
Amid the sharp military escalation, odds of a full Iran blockade by July 13 jumped 50% since the last update 4 days ago
Source: zerohedge, Polymarket
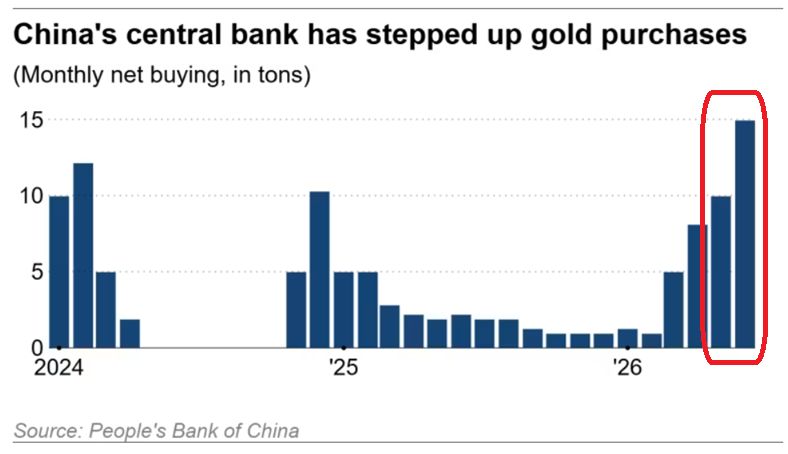
China's gold purchases are ACCELERATING:
China's central bank acquired +15 tonnes of gold in June, the largest monthly purchase in at least 2.5 years. This also marks the 20th consecutive monthly addition. Year-to-date, the country has increased its gold reserves by a total of +40 tonnes. This lifts China's total gold reserves to a record 2,346 tonnes, or 9% of its total FX reserves, near an all-time high. China is extremely bullish on gold. Source: Global Markets Investor
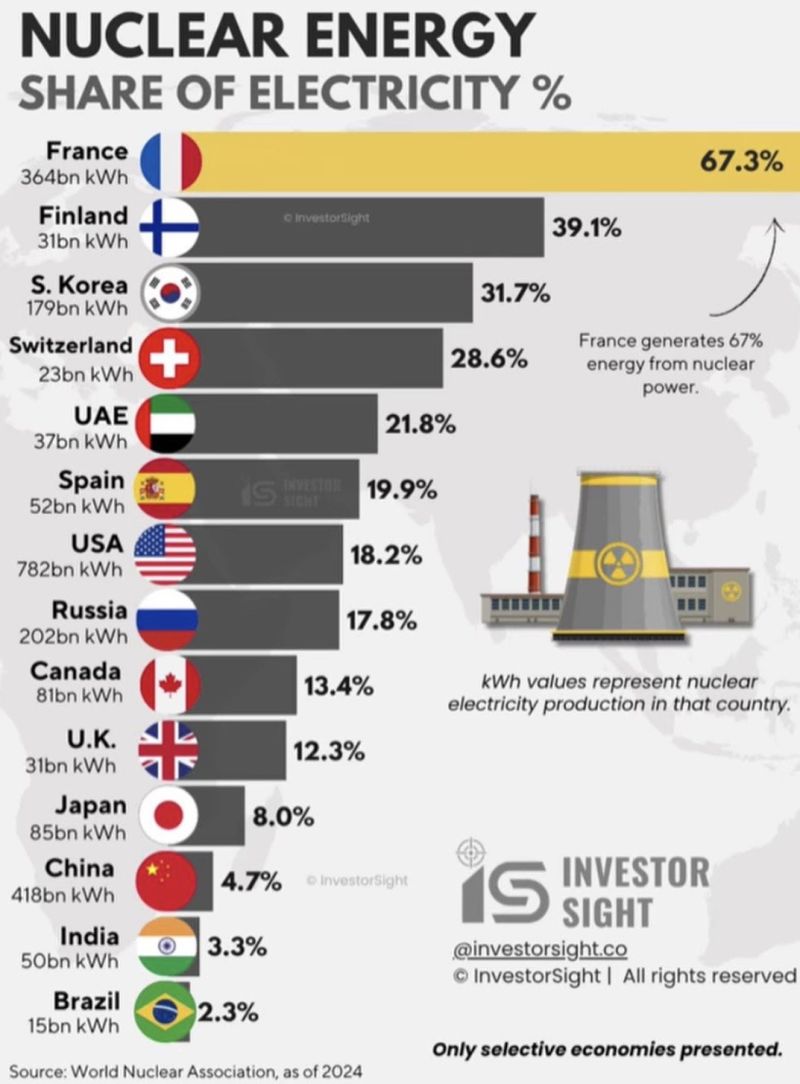
France generates 67% of its electricity from nuclear power, the highest share of any major economy.
Extreme heat just forced 3 reactors offline and cut output at 8 more. That gap gets filled by gas. Right when European gas markets are already stretched. Source: Jack Prandelli on X
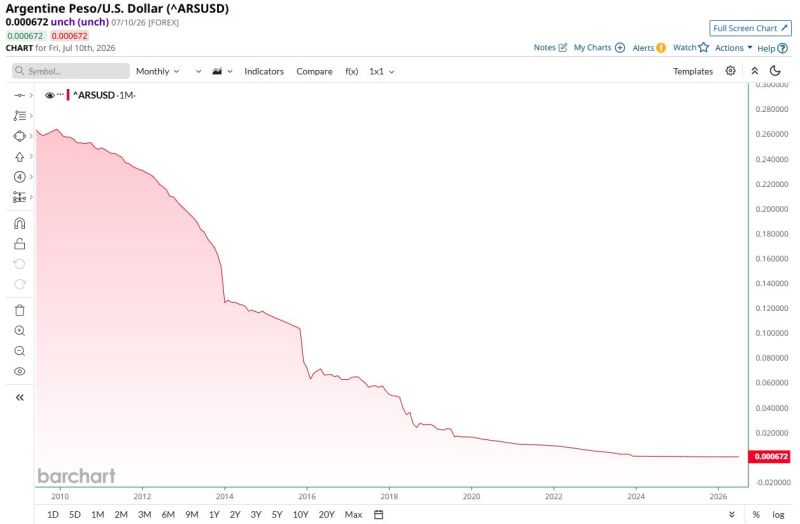
Argentina
Argentina's Peso has fallen to an all-time low against the U.S. Dollar and has now collapsed 99.8% since 2009 Source: Barchart
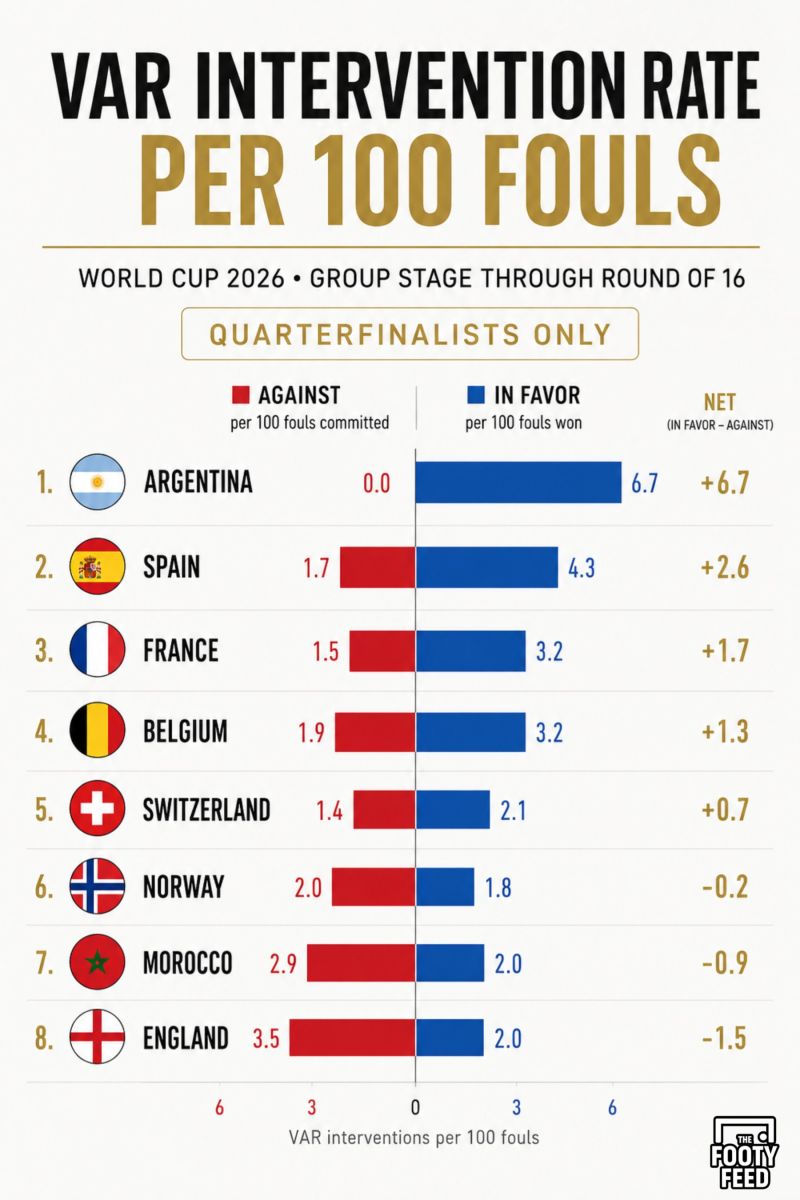
VAR intervention rate per 100 fools
Source: The Footy Feed