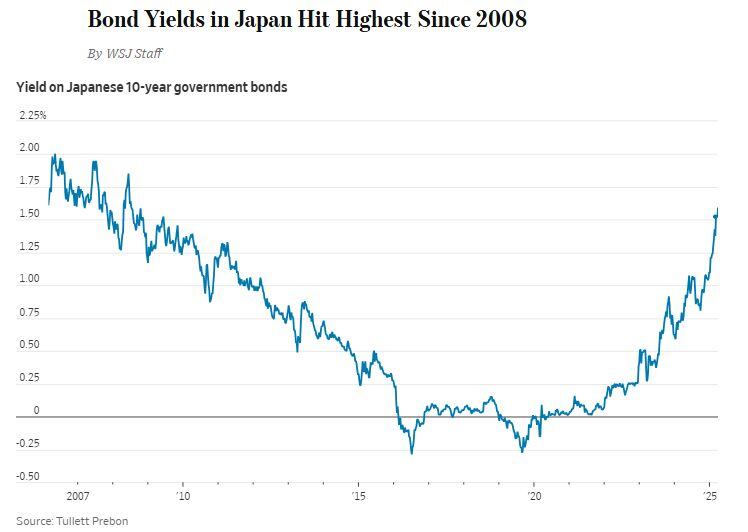
Japanese 10-Year Bond Yield jumps to highest level since the Global Financial Crisis 🚨
Source: Barchart
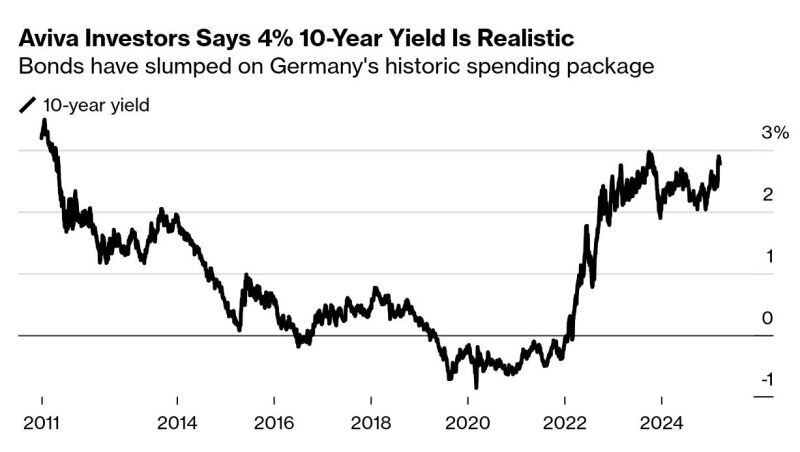
🔴 Germany’s 10-year bond yield rising to 4% is “entirely feasible” as a reset in the country’s borrowing costs plays out, according to Aviva Investors.
The rate surged to nearly 3% in recent weeks as Germany’s incoming chancellor spearheaded a huge spending package that is expected to lead to billions of euros in extra bond sales. Vasileios Gkionakis, senior economist and strategist at Aviva Investors, says yields are likely to keep rising as the fiscal measures boost economic growth. ➡️ 4% for German 10-Year Bund would mean German mortgages at 5% to 6% and the burst of the epic German real estate bubble. Would it also mean Italian, Spanish and French bonds yields at a level that could trigger the next Euro crisis. Good luck. Source: Bloomberg
Bonds don't love the cooler-than-expected February CPI report
Weakness in airfares may not show up in the PCE, the Fed's preferred gauge, which pulls that price data from the PPI And still-firmer goods prices could lead to core PCE, for a change, running higher than core CPI Source: Nick Timiraos @NickTimiraos

Japan 40Y bond yield hits highest in history.
Eventually markets will remember that Japan has to roll over the world's biggest debt load ever assembled. Source: Bloomberg, www.zerohedge.com

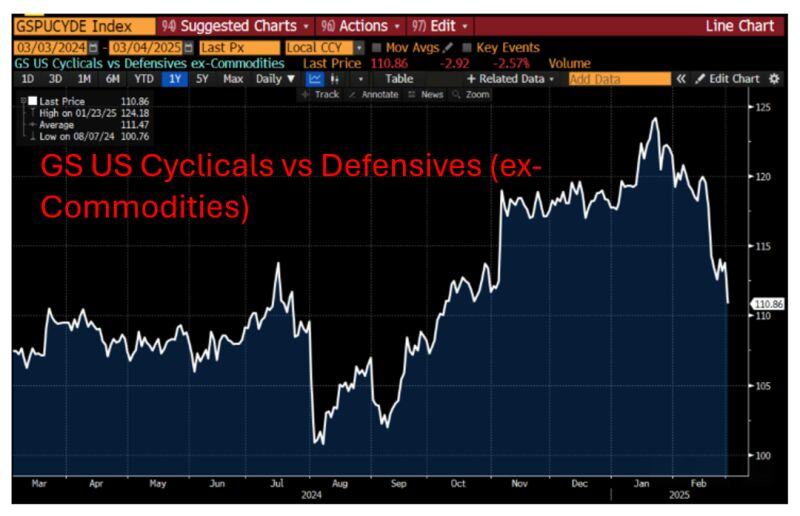
A clear message from the market:
Cyclicals vs defensives peaked in late January, with underperformance accelerating in mid-February. If you add to this the inverted 3m-10y yield curve, the odds of recession are on the rise. Source: Bloomberg, RBC
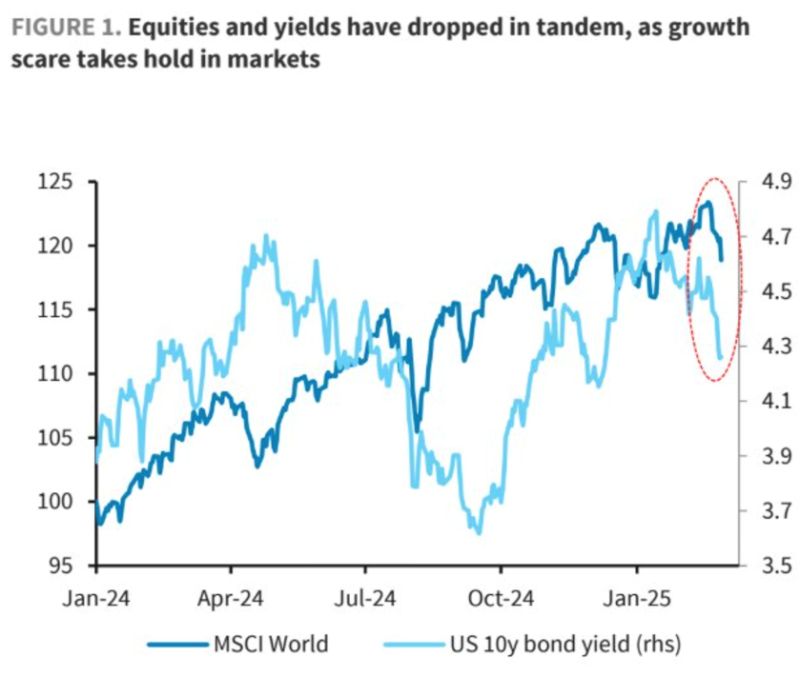
We have seen some positive correlation between bond yields and stocks recently.
Adding long-dated US Treasuries as a portfolio hedge now makes more sense. Source: Bloomberg, Barclays
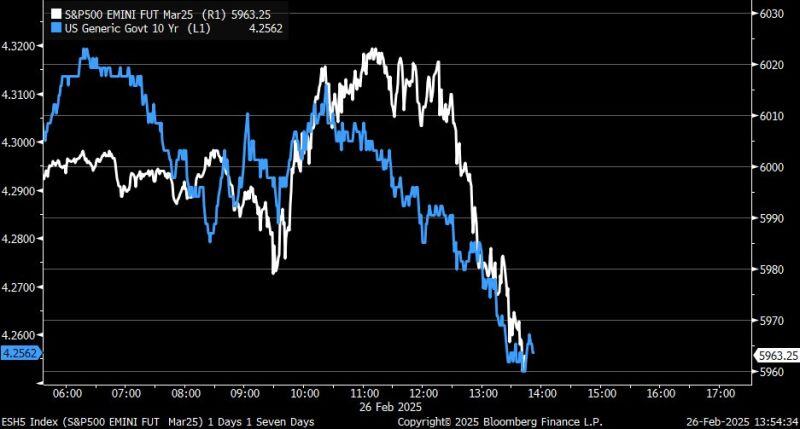
Yesterday, S&P 500 and 10y Treasury yield rolled over intraday ...
markets showing more concern for growth as opposed to inflation when it comes to tariffs. Source: Kevin Gordon @KevRGordon on X, Bloomberg
The Trump 1.0 put was on equities $SPY
Will the Trump 2.0 put be on us treasuries $TLT ??? Source: Geiger Capital @Geiger_Capital on X, Bloomberg