Straight from the Desk
Syz the moment
Live feeds, charts, breaking stories, all day long.
- All
- equities
- United States
- Macroeconomics
- Food for Thoughts
- markets
- Central banks
- Fixed Income
- bitcoin
- Asia
- europe
- investing
- geopolitics
- gold
- technical analysis
- Commodities
- Crypto
- AI
- Technology
- nvidia
- ETF
- earnings
- Forex
- china
- Real Estate
- oil
- banking
- Volatility
- energy
- magnificent-7
- apple
- Alternatives
- emerging-markets
- switzerland
- tesla
- United Kingdom
- Middle East
- assetmanagement
- amazon
- microsoft
- russia
- ethereum
- ESG
- meta
- Industrial-production
- bankruptcy
- Healthcare
- Turkey
- Global Markets Outlook
- africa
- Market Outlook
- brics
- performance
⚛️ THE "URANIUM SQUEEZE": DATA CENTERS VS. SUPPLY CHAINS.
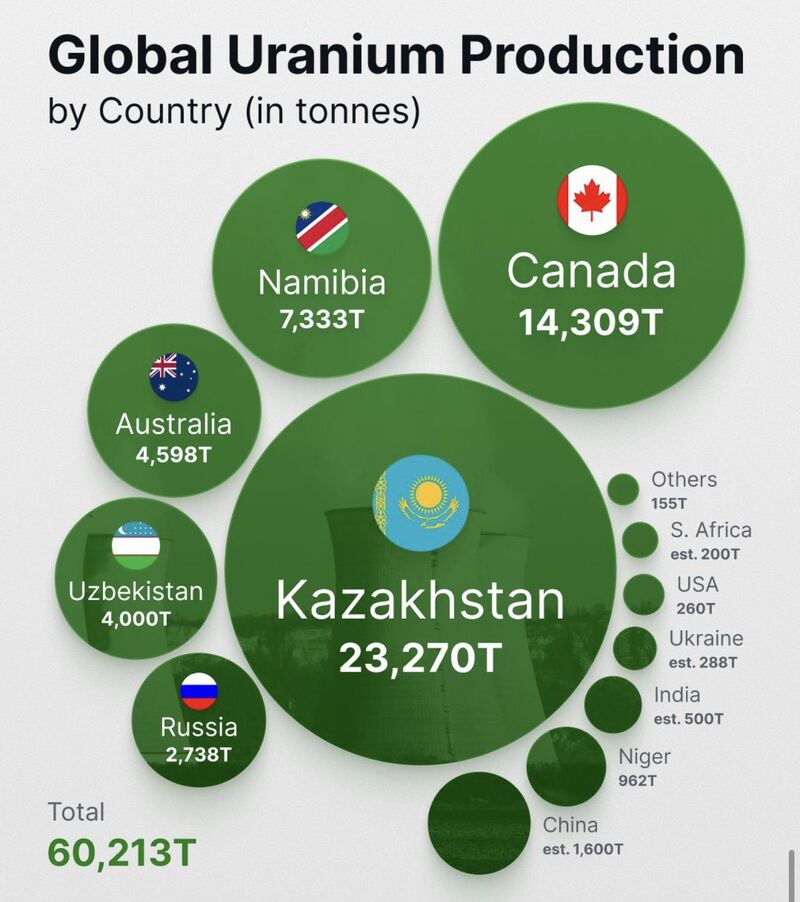
If you think the energy transition is just about solar panels and wind turbines, you’re missing the biggest structural shift in the market right now. Uranium is no longer just a commodity. It is becoming a top-tier strategic asset. 🛡️ Here is why the "Nuclear Renaissance" is reaching a boiling point: 1️⃣ The AI Power Hunger 🤖 Large language models don't just need data; they need uninterrupted, carbon-free baseload power. * Tech giants (Amazon, Google, Microsoft) are pivotting to nuclear to power their massive AI data centers. Unlike renewables, nuclear provides the 24/7 "always-on" energy that AI requires to function. 2️⃣ Extreme Supply Concentration 🇰🇿 The global supply map is shockingly narrow. Kazakhstan dominates the market, producing ~40% of the world’s uranium. Canada and Namibia form the critical "second tier" for Western energy security. In a world of geopolitical tension, depending on a single region for 40% of your fuel is a massive risk. 3️⃣ The Looming Deficit 📉 The math doesn't add up. We are seeing record reactor restarts and new builds globally. Primary mine production is lagging behind actual reactor requirements. Secondary supplies (stockpiles) are thinning out fast. The Bottom Line: As we move toward a high-tech, low-carbon future, the demand for "reliable green power" is skyrocketing—but the "fuel" for that power is controlled by just a handful of players. In a tight, concentrated market, security of supply is the only thing that matters. Source: Jack Prandelli on X
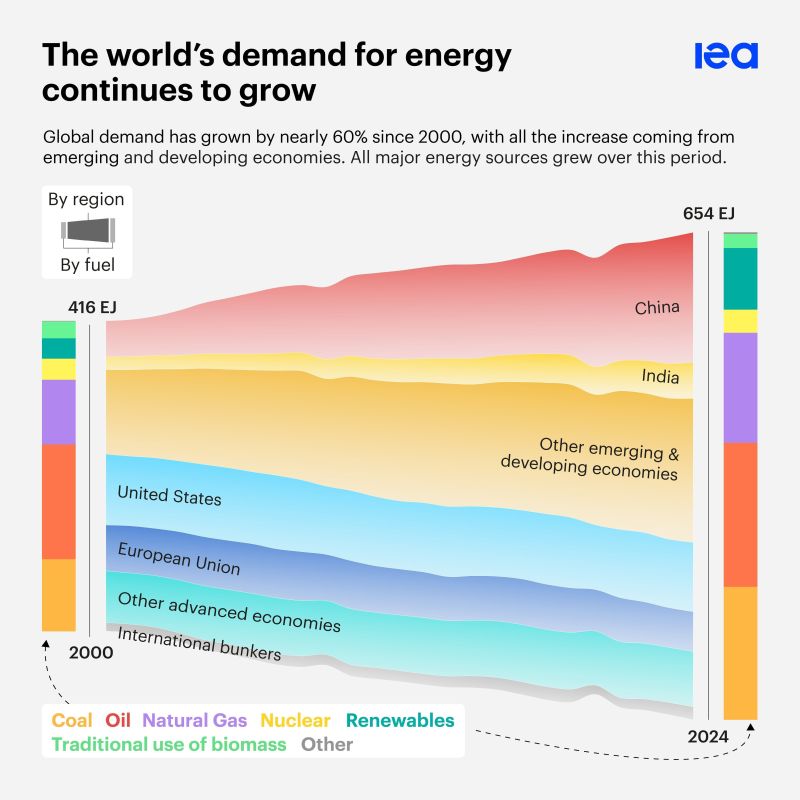
Global energy demand has risen nearly 60% since 2000, with more than half of the increase taking place in China
In the coming years, other emerging economies, led by India & Southeast Asia, are set to become increasingly influential in growth trends . Source: IEA
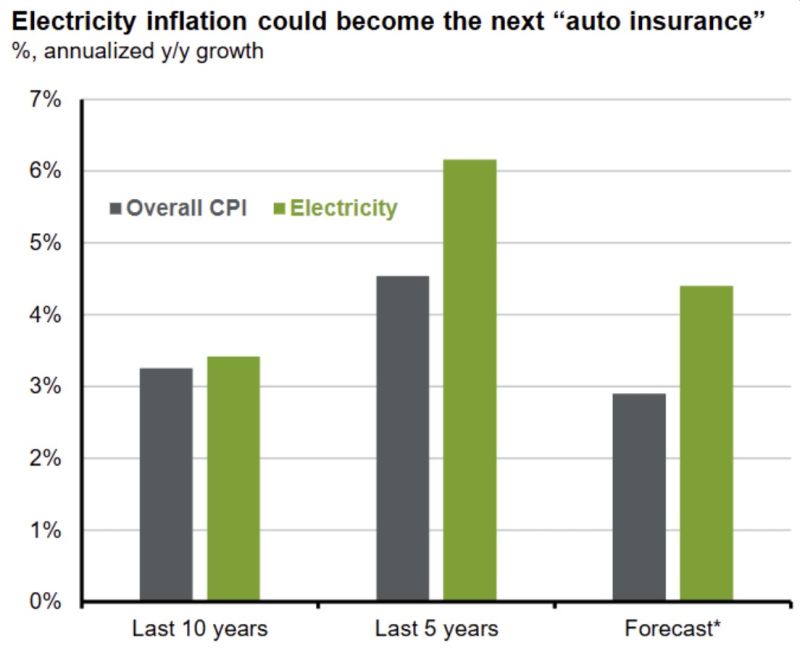
JP Morgan AM chart on electricity inflation.
The AI/Datacenter effect is clearly visible. It matched CPI until the last 5 years and is getting worse. Will consumers start to revolt? Source: JPAM, RBC
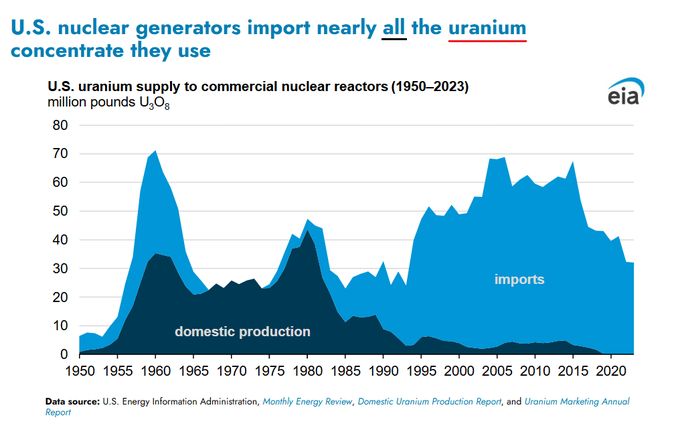
🤯 The Hidden Vulnerability Powering America: 20% of US Electricity is on Borrowed Time.
Did you know Nuclear energy generates 20% of all US electricity? That's our clean, reliable base load. But here’s the terrifying truth: 🇺🇸 The US once supplied nearly all its own Uranium fuel. TODAY: The US imports nearly 100% of the uranium we use. Let that sink in. One-fifth of US power generation is entirely dependent on foreign governments. In a world defined by geopolitical turbulence and supply chain risk, this isn't just an economic issue—it's a massive national security risk. The Mandate is Clear: The US must shift from relying on external sourcing to securing a resilient, domestic nuclear fuel cycle. Self-sufficiency is no longer optional; it’s paramount for energy independence and long-term stability. Source: Lukas Ekwueme @ekwufinance
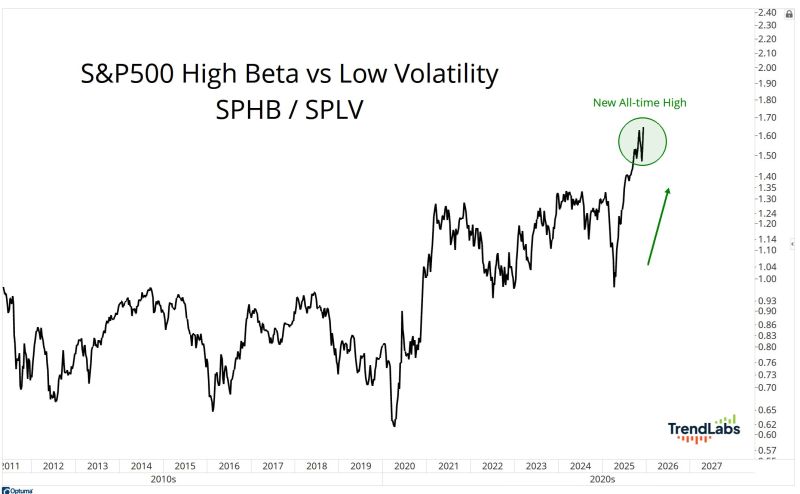
J-C Parets: When we talk about healthy sector rotation, this is exactly what that means.
High Beta is making new all-time highs, AND it's making new all-time highs relative to Low Volatility. That's not weak breadth. That's not deterioration. That's called a raging bull market.
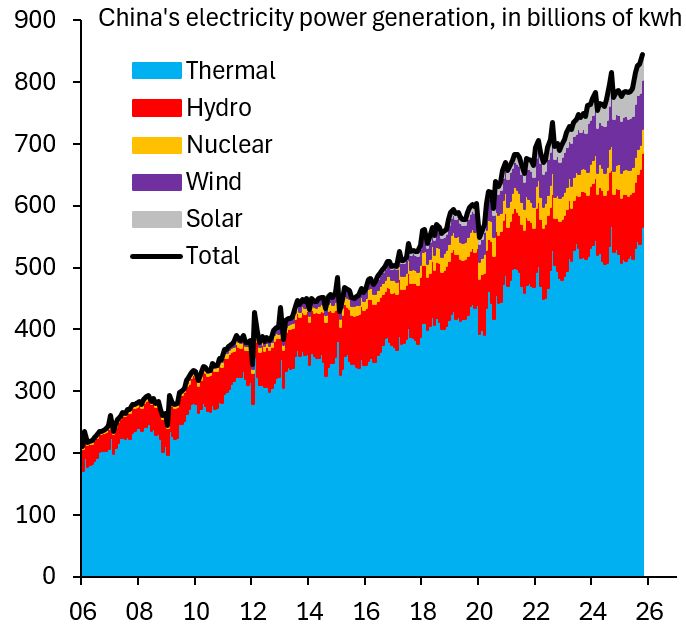
Lots of people are going on about cheap electricity in China and how this will allow it to win the AI race with the US.
Here's the thing about that electricity: it's from burning fossil fuels like coal - see chart below courtesy of Robin Brooks. Note however that China has massive plans to progressively replace fossil fuels by renewables and nuclear.
Investing with intelligence
Our latest research, commentary and market outlooks


