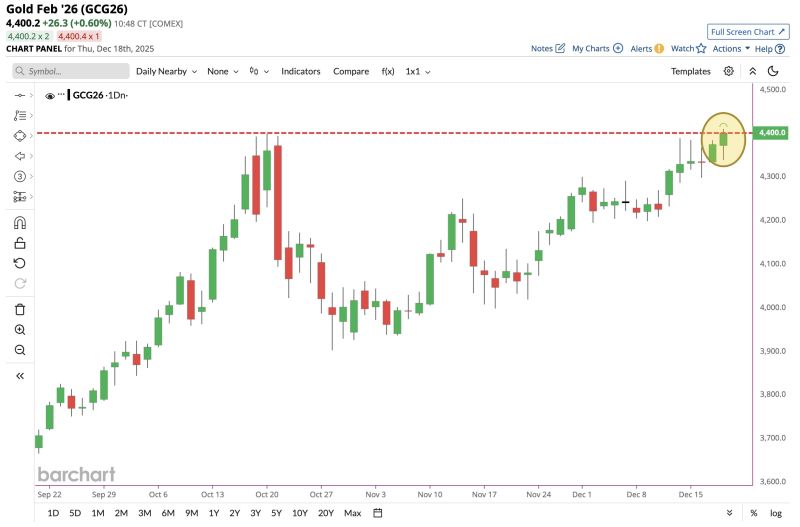
JUST IN 🚨: Gold hits $4,400 for the first time in history 📈📈
Source: Barchart
🔥Gold and silver are moving almost perfectly in line with Japanese government bond yields:
Japan's 10-year government bond yield has risen roughly 1.5 percentage points since the beginning of 2023, reaching 1.98%, the highest level since the 1990s. During this same period, gold and silver prices have skyrocketed by 135% and 175%, respectively. Are precious metals being used as a primary hedge against the rising cost of government debt? Source: Global Markets Investor

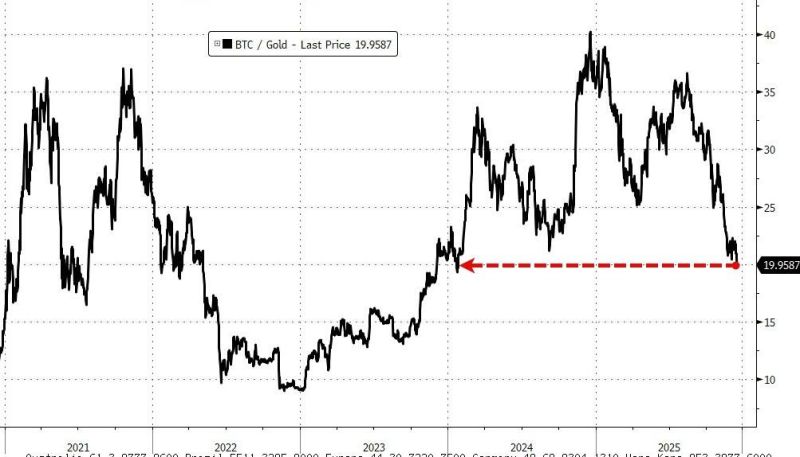
The BTC/Gold ratio back below 20x for the first time since Jan 2024...
Source: zerohedge
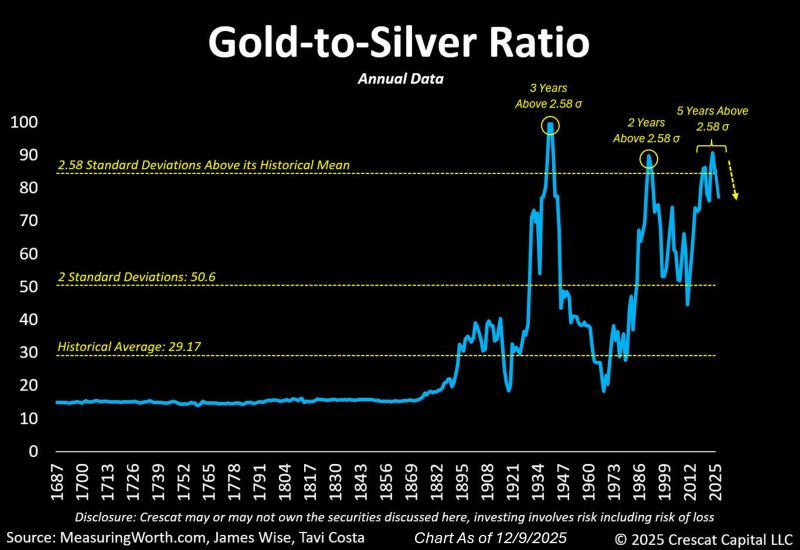
The gold-to-silver ratio is starting to move abruptly, as it often does after reaching extremely elevated levels.
Source: Tavi Costa
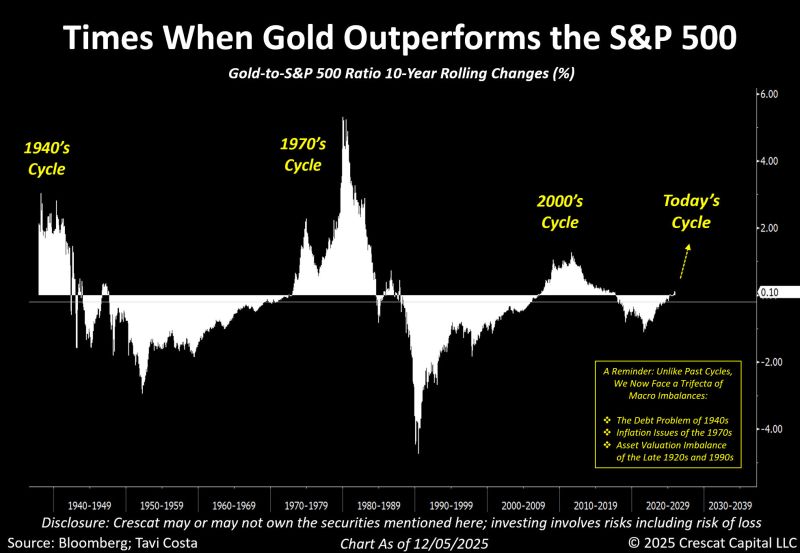
Gold relative to S&P 500: are we just at the start of the cycle?
A fascinating chart by Otavio (Tavi) Costa Gold relative performance dynamic follows very long-term cycles, and we’re likely only in the early stages of this one. As Tavi points out, we now face a trifecta of macro imbalances: ▪️The Debt Problem of the 1940s ▪️Inflation Issues of the 1970s ▪️Asset Valuation Imbalance of the Late 1920s and 1990s Source: Bloomberg, Crescat Capital
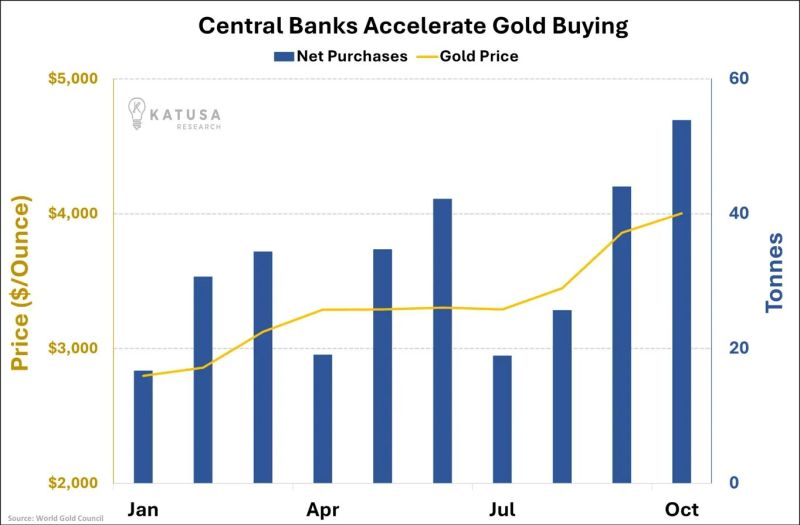
This chart destroys every "gold is too expensive" argument
They were buying 20 tonnes when gold was at $3,000. Now they're buying 55 tonnes at $4,000. Source: Katusa Research @KatusaResearch
Gold's long-term correlation with the S&P 500 has just reached an extremely high level, only seen in...August 2007.
Source: Guilherme Tavares i3 invest

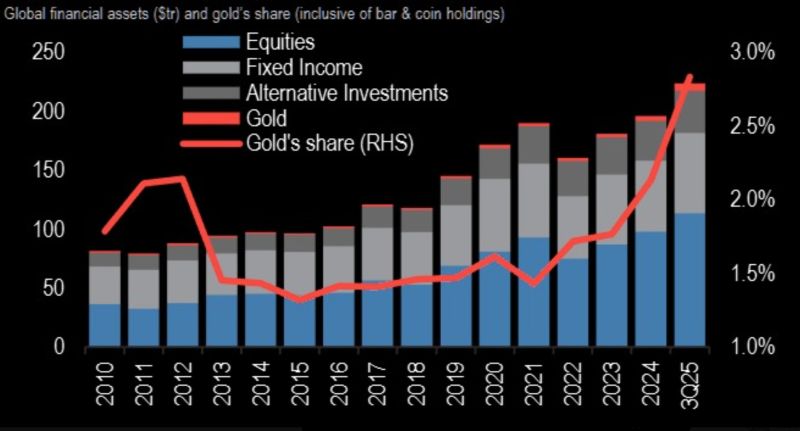
Gold is only 2.8% of investor AUM... imagine 4–5%.
Source: The Market Ear