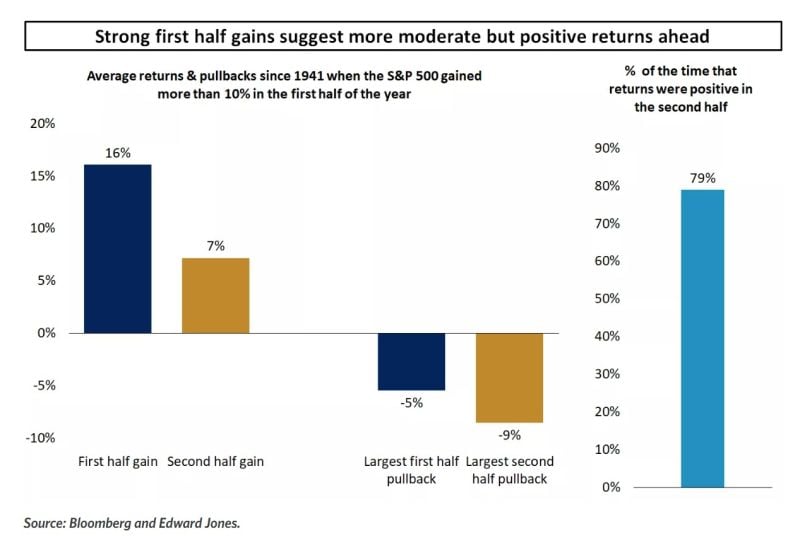
Even as volatility is picking up, the bull market could stay intact.
Going back to 1941, whenever the S&P 500 rose by 10% or more in the first six months of the year, it has risen by 7% on average in the second half. And the percentage of time that returns were positive in the second half of the year was almost 80% vs. 66% for any given period. The one caveat is that pullbacks in the second half tend to be deeper than the first half, averaging 9%. Source: Edward Jones, Bloomberg
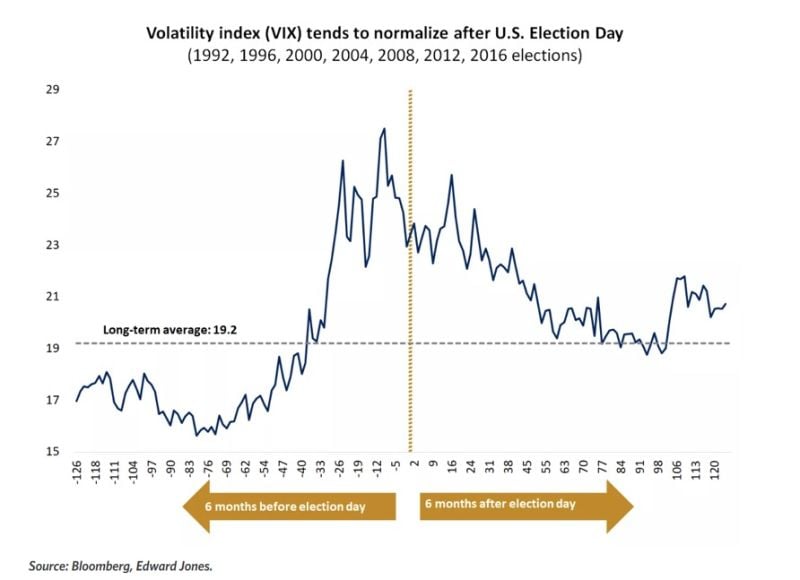
Expect a pickup in volatility as we head towards elections.
History shows us that market volatility tends to increase ahead of election day, and then subside afterwards, regardless of who is in power. This could be in part because some uncertainty is lifted after the election is over, and markets can again focus on opportunities ahead. Source: Edward Jones
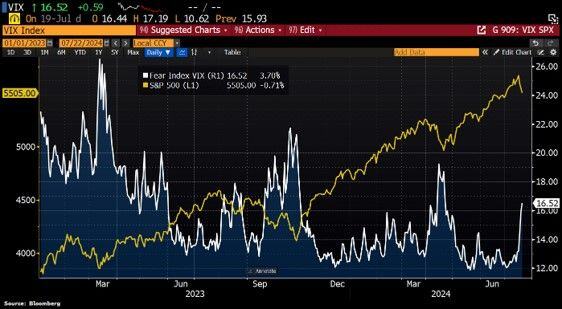
The end of complacency? Fear Index Vix has jumped 32.6% last week, the biggest weekly increase since March 2023.
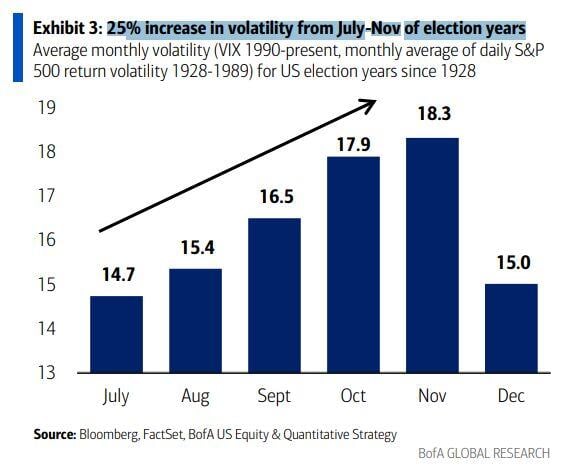
But at 16.5, the Vix level is still below the long-term average of 19.8. And remember that during election years, volatility tends to increase by 25% between July and November... Source: HolgerZ, Bloomberg
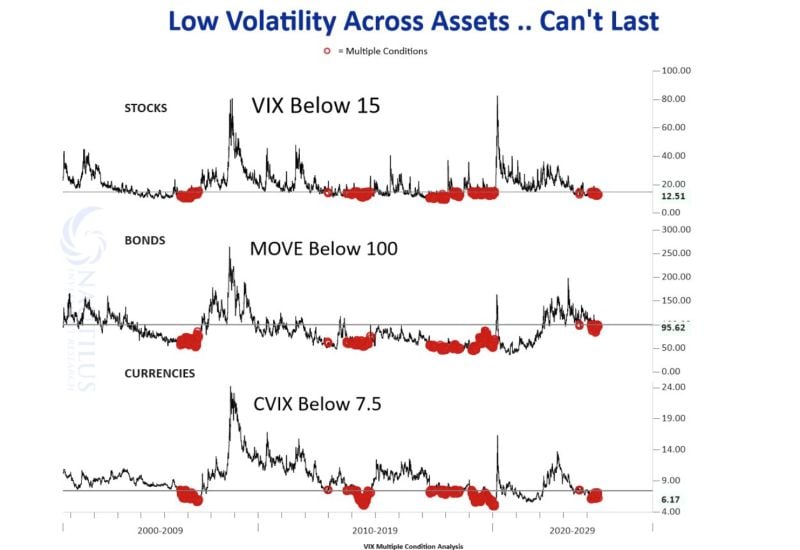
There is low volatility across asset classes.
Can it last? Source: Nautilus Research
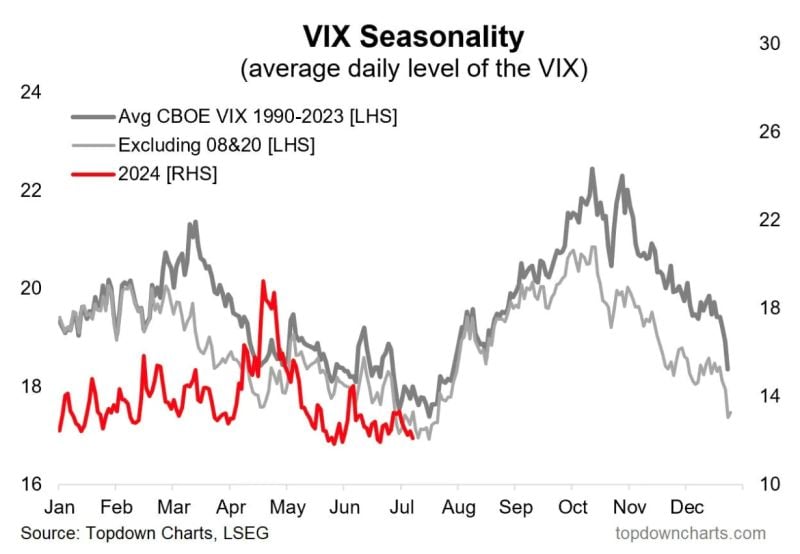
During Presidential election years, volatility tend to pick up EXACTLY at this time of the year
Source: Topdown Charts
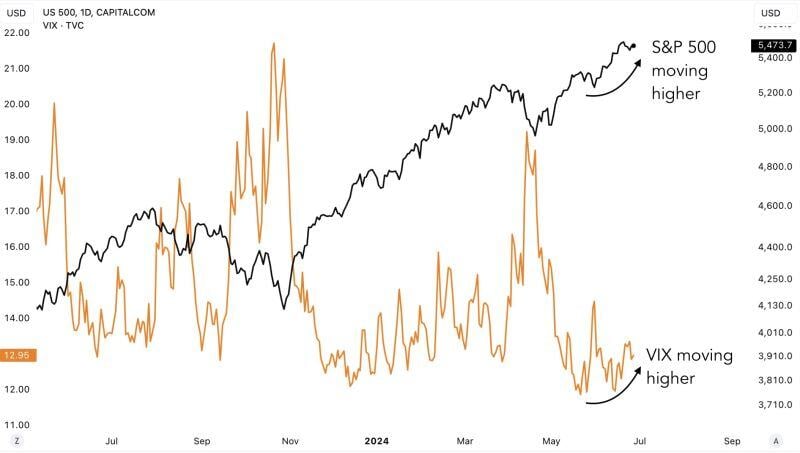
Major divergence spotted:
The VIX has been trending higher since mid-May. But even the SP500 has been moving higher. This is an anomaly. Source: Game of Trades
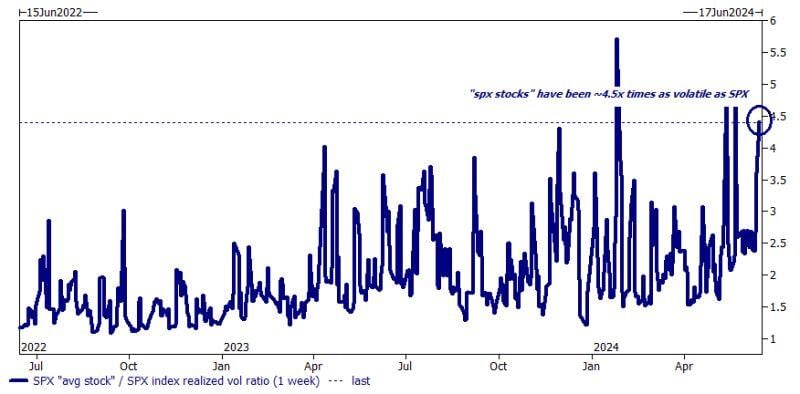
Wow. The average S&P500 stock has been on average 4.5x as volatile as the broader index!
Chart: Goldman Sachs Source: Markets & Mayhem
History shows an average 25% increase in volatility from July-Nov of election years...
Mike Zaccardi, CFA, CMT, BofA