19 Aug 2024
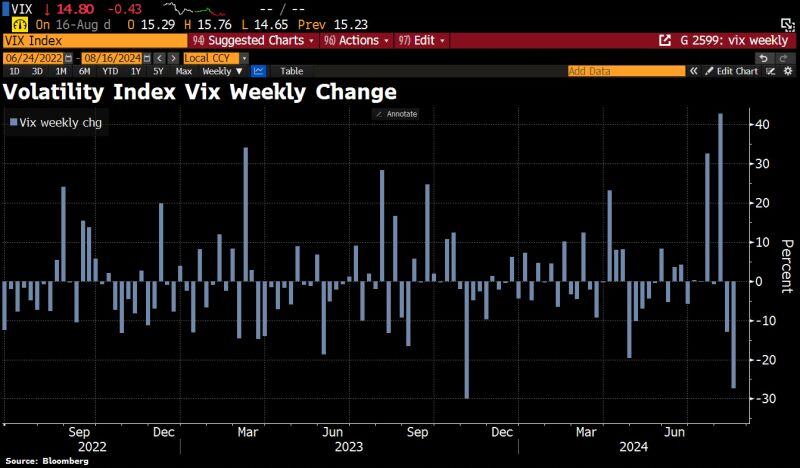
Fear Index Vix dropped 27.3% this week, most since Nov 2023 as recession fears have faded and bulls are firmly back in control of the narrative.
Source: Bloomberg, HolgerZ
16 Aug 2024
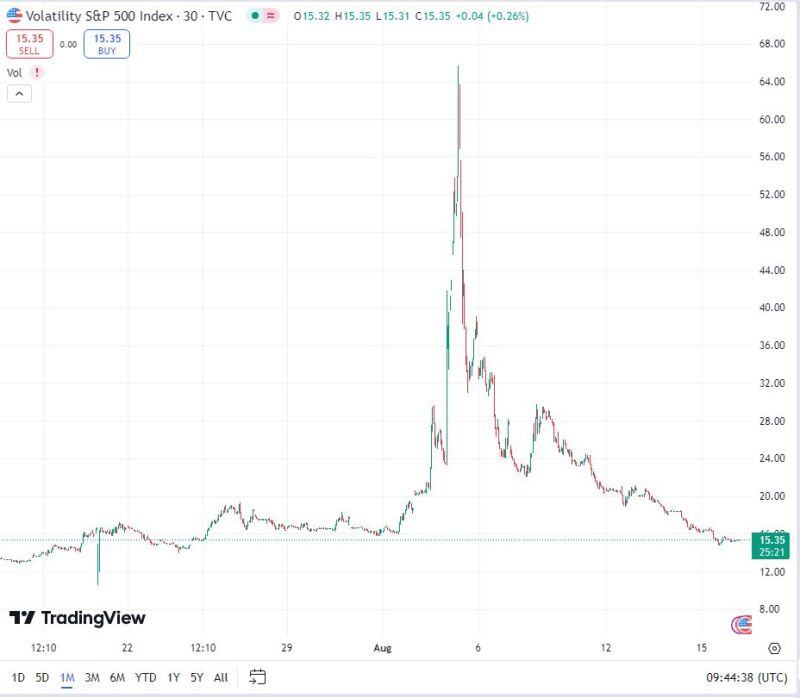
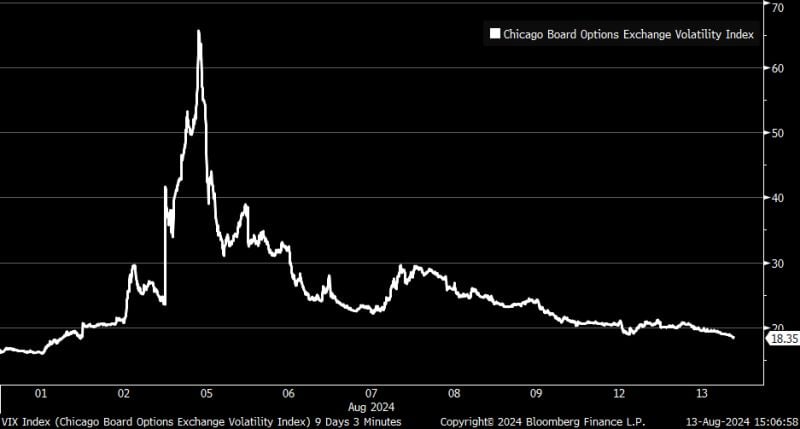
The VIX is now LOWER than it was before August 1st.... what a round trip...
Source: TradingView
15 Aug 2024
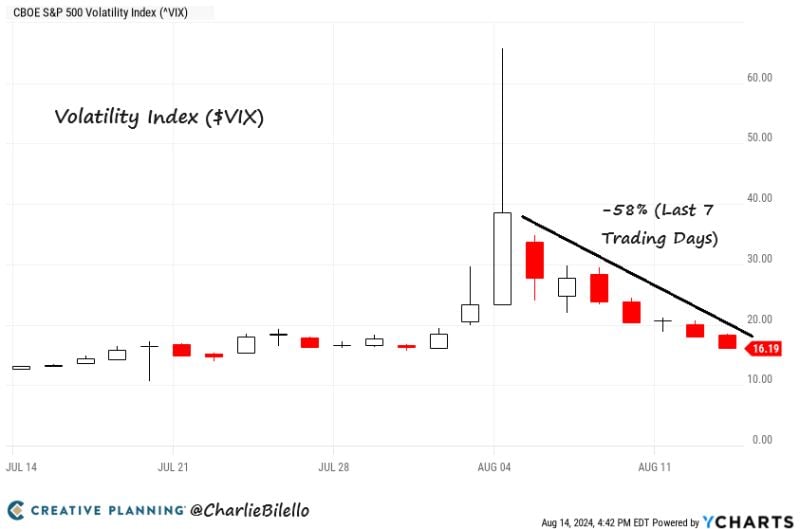
The $VIX has declined 58% (from 38.57 to 16.19) over the last 7 trading days, the biggest 7-day volatility crash in history.
Source: Charlie Bilello
15 Aug 2024
BREAKING: For those who were off the last 2 weeks, nothing happened: the $VIX is back to where it was on August 1...
Source: Stocktwits, Bloomberg
13 Aug 2024
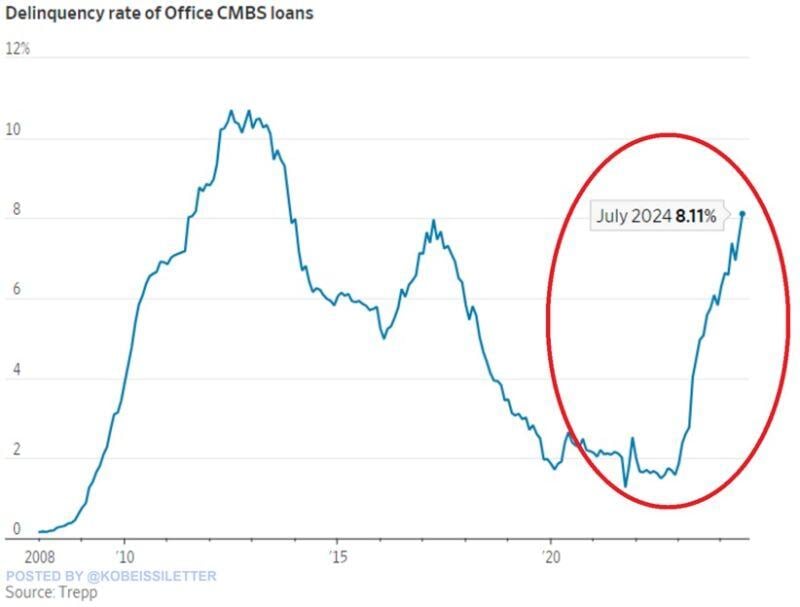
The delinquency rate on commercial mortgage-backed securities (CMBS) for offices spiked to 8.1% in July, the highest in 11 years.
The delinquency rate of office CMBS loans has QUADRUPLED in 1.5 years. Delinquencies are currently rising at a faster pace than during the 2008 Financial Crisis. A top AAA-rated CMBS experienced a $40 million loss in May for the first time since the 2008 Financial Crisis. Source: The Kobeissi Letter
12 Aug 2024
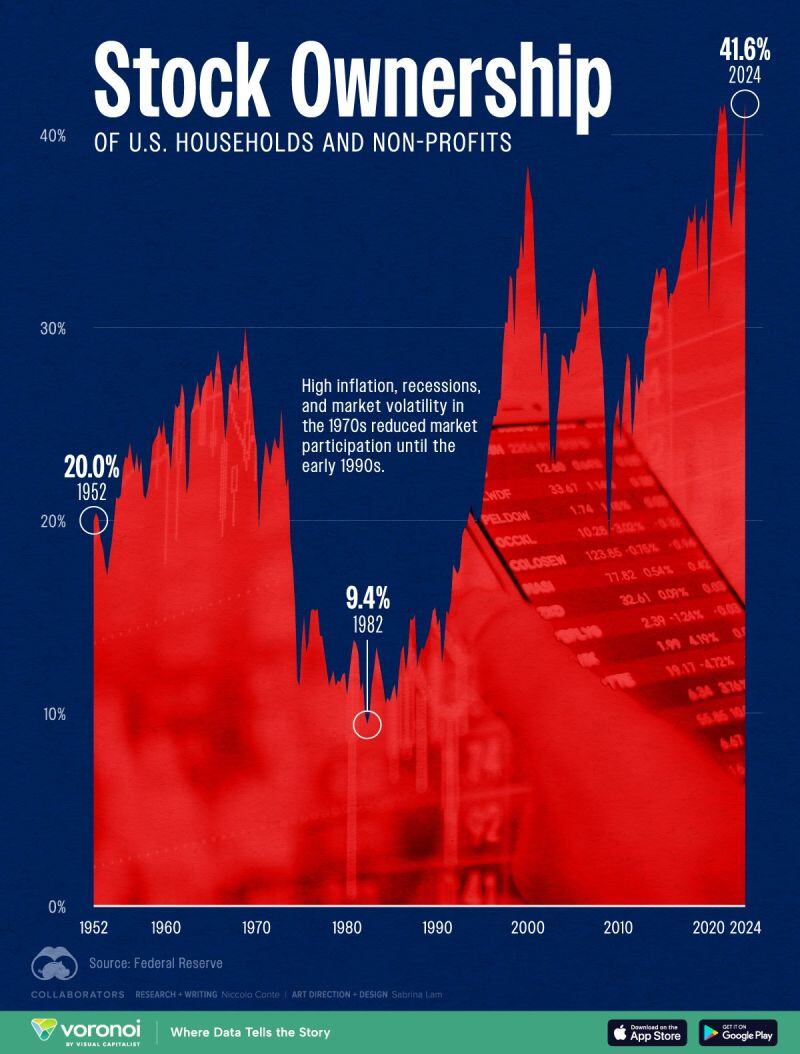
American stock ownership is back at all-time highs
Source: Markets & Mayhem, Visual Capitalist
12 Aug 2024
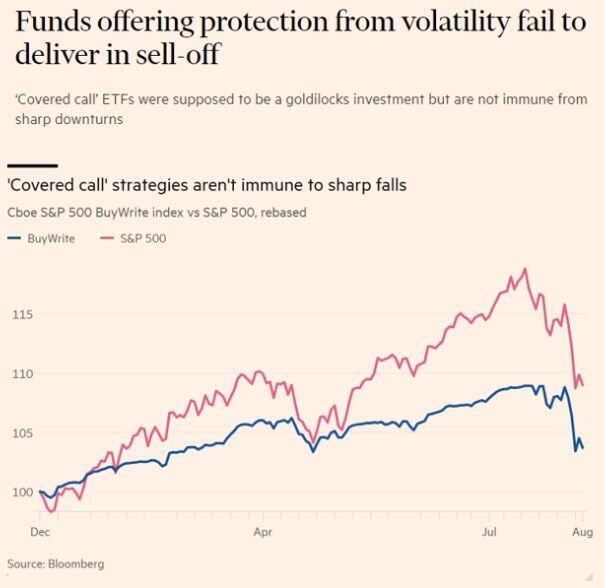
There is no free lunch in finance
Funds designed to protect investors from volatility failed to protect investors during periods of high volatility Source: FT, Barchart
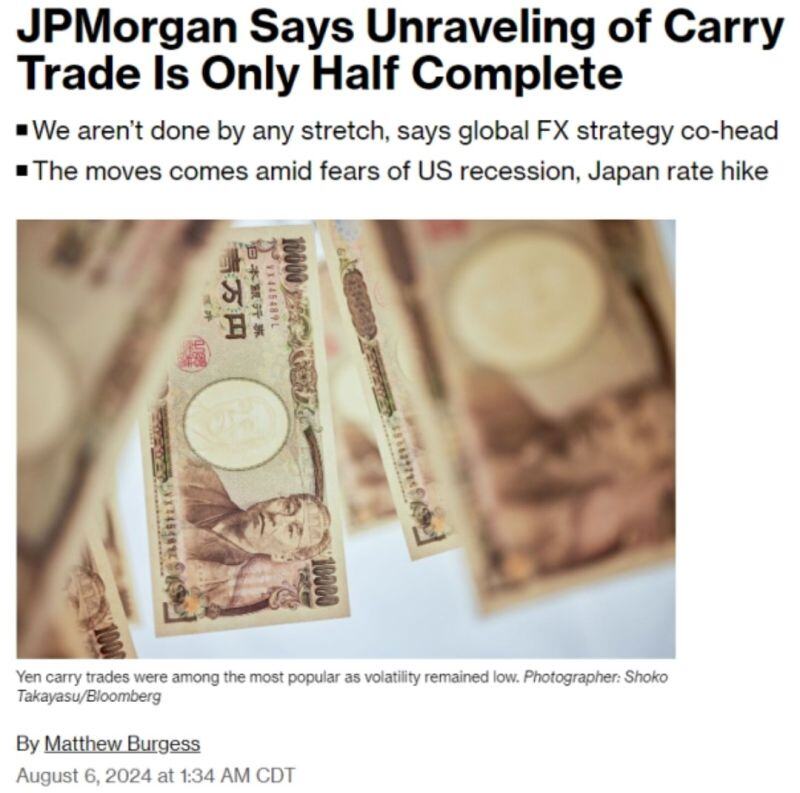
6 Aug 2024
The Japanese Yen Carry Trade unwinding is only 50% complete warns JP Morgan
Source: Win Smart