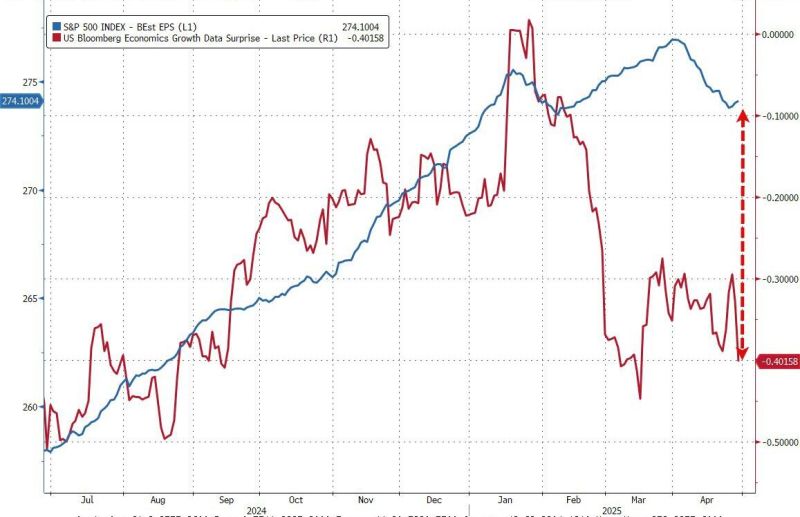
US earnings expectations versus US economic growth surprises dichotomy
▶️ While macro growth expectations continue to fade, EPS expectations are down only modestly (and actually starting to inflect modestly higher in the last couple of days)... Source: Bloomberg, www.zerohedge.com
🔴 Nvidia CEO Jensen Huang said Wednesday that China is “not behind” in artificial intelligence, and that Huawei is “one of the most formidable technology companies in the world.”
👉 Speaking to reporters at a tech conference in Washington, D.C., Huang said China may be “right behind” the U.S. for now, but it’s a narrow gap. “We are very close,” he said. “Remember this is a long-term, infinite race.” 👉 The Trump administration this month restricted the shipment of Nvidia’s H20 chips to China without a license. That technology, which is related to the Hopper chips used in the rest of the world, was developed to comply with previous U.S. export restrictions. Nvidia said it would take a $5.5 billion hit on the restriction. 👉 Huawei, which is on a U.S. trade blacklist, is reportedly working on an AI chip of its own for Chinese customers. “They’re incredible in computing and network technology, all these essential capabilities to advance AI,” Huang said. “They have made enormous progress in the last several years.”

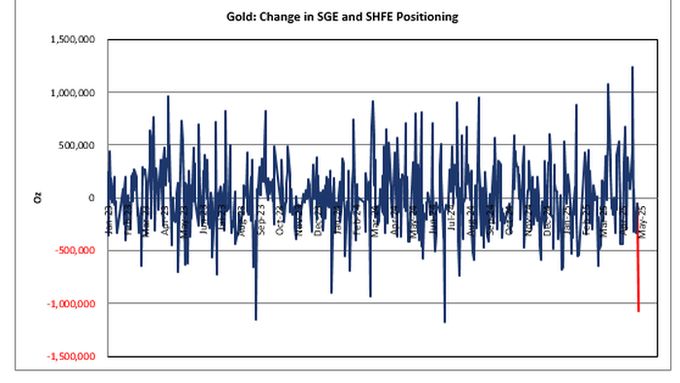
Gold Breaks Down As China Hits The Sell Button And CTAs Line Up To Follow
According to reports, China just dumped a million ounces of gold Source: zerohedge
UPDATE: Weekly jobless claims jump to 241,000, higher than expected
Source: Stocktwits
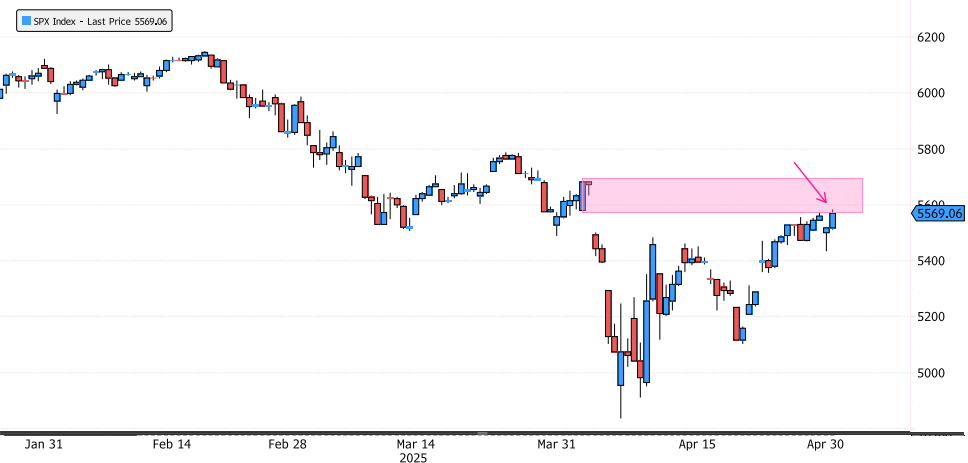
S&P 500 Index Back on 1st Supply Zone
The S&P 500 Index has rallied 17% since the lows and is now back on the 1st important supply zone between 5571-5695. Will it be able to close above 5695? Keep an eye on the price action over the next few days. Source: Bloomberg
A currency's reserve status should not be taken for granted.
Just look at what happened to the pound... Source: Augur Infinity

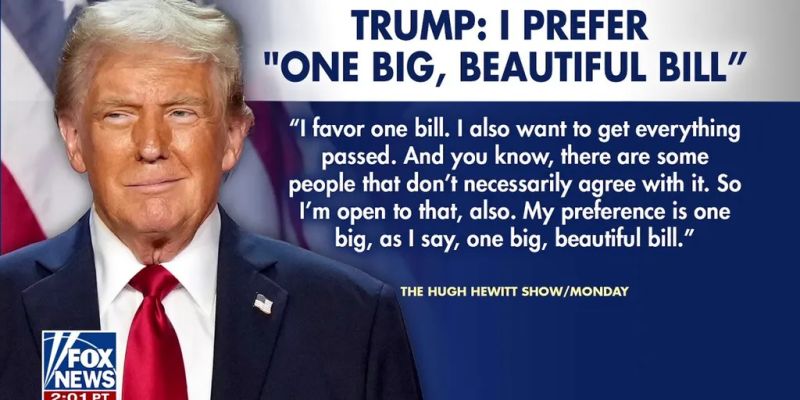
TRUMP: THE BIGGEST BILL IN AMERICAN HISTORY IS COMING
No tax on tips, no tax on Social security, no tax on overtime. "In the coming weeks and months, we will pass the largest tax cuts in American history and that will include no tax on tips, no tax on Social Security, no tax on overtime. It's called the One Big Beautiful Bill, and it will be the biggest bill ever passed in our country's history. It will include the biggest tax cuts, regulation cuts, military supremacy, and just about everything else." Source: @RapidResponse47 thru Mario Nawfal, FoxNews
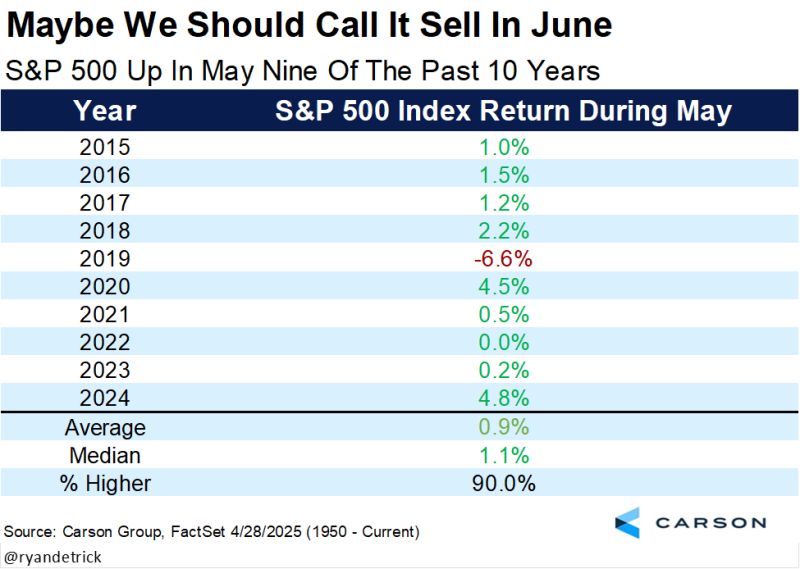
Before you Sell in May, just remember this month has been higher 9 of the past 10 years.
Source: Ryan Detrick, Carson