Straight from the Desk
Syz the moment
Live feeds, charts, breaking stories, all day long.
- All
- equities
- United States
- Macroeconomics
- Food for Thoughts
- markets
- Central banks
- Fixed Income
- bitcoin
- Asia
- europe
- investing
- geopolitics
- gold
- technical analysis
- Commodities
- Crypto
- AI
- Technology
- nvidia
- ETF
- earnings
- Forex
- china
- Real Estate
- oil
- banking
- Volatility
- energy
- magnificent-7
- apple
- Alternatives
- emerging-markets
- switzerland
- tesla
- United Kingdom
- Middle East
- assetmanagement
- amazon
- microsoft
- russia
- ethereum
- ESG
- meta
- Industrial-production
- bankruptcy
- Healthcare
- Turkey
- Global Markets Outlook
- africa
- Market Outlook
- brics
- performance
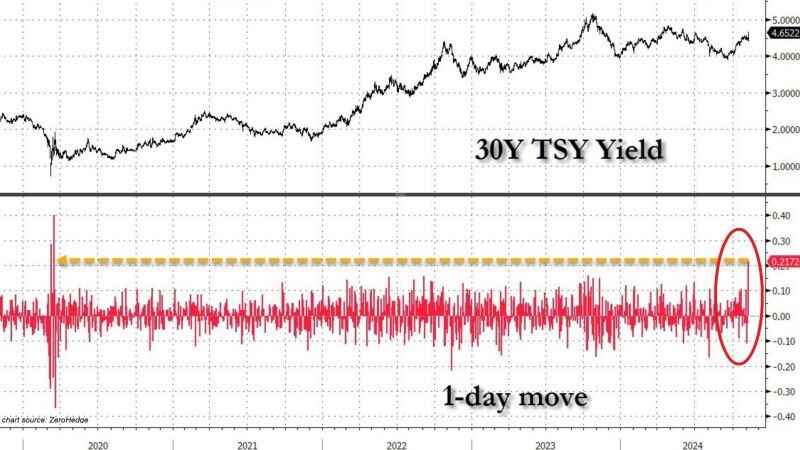
THIS IS AN ABSOLUTELY WILD MOVE >>>
The 30-year US Treasury jumped by a massive 22 basis points, the biggest spike since the COVID CRISIS. At the same time, the 10-year yield jumped by 16 basis points, to the highest since July. Meanwhile, the Fed is going to cut today.... Source: Global Markets Investor
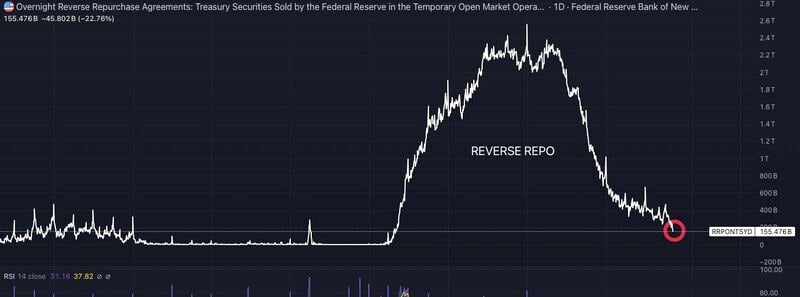
🚨 THE SHOCKING CHART OF THE DAY >>>
THE FEDERAL RESERVES REVERSE REPO HAS FALLEN TO $155 BILLION WHICH IS THE FIRST TIME WE SEEN THIS LEVEL SINCE MAY 2021🚨 USUALLY WHEN IT FALLS IT LOWERS YIELDS BUT INSTEAD THEY’RE MOVING UP AND 10YR YIELDS FLEW TO 4.3% LAST WEEK. It was initially used to pull money out of the economy to reduce inflation. Then it went back into economy and then into equites. What's next? Source: Mike Investing on X
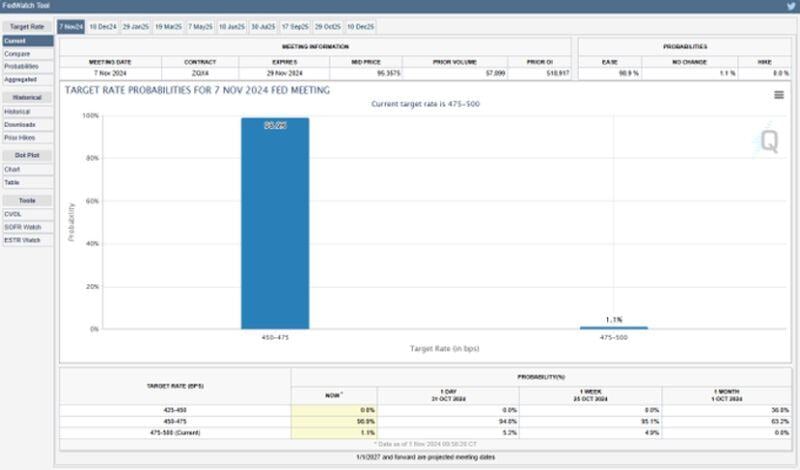
🚨 There is now a 99% chance of a 25 bps interest rate cut at next week's FOMC Meeting 🚨
Source: Barchart
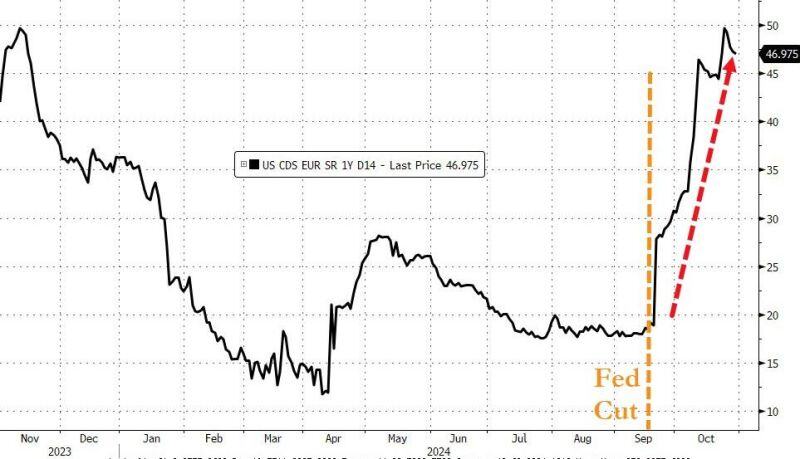
Since The Fed cut rates, USA Sovereign risk has exploded higher...
Source: www.zerohedge.com, Bloomberg
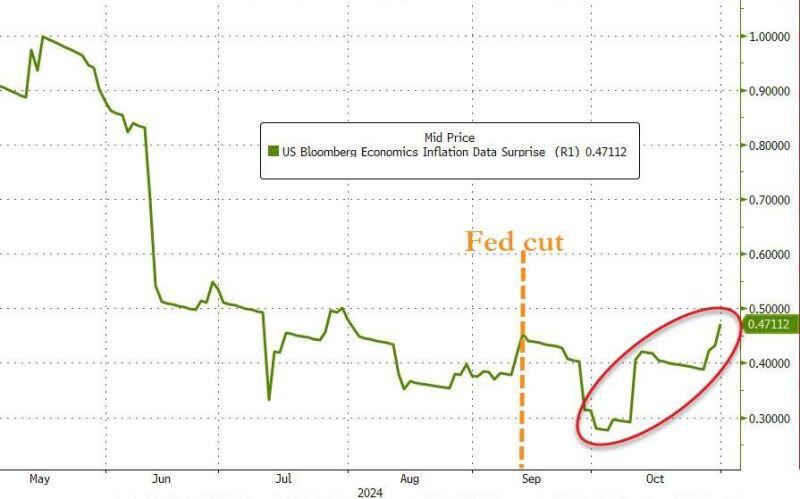
Inflation surprises are picking up since Fed rate cut...
Source: www.zerohedge.com, Bloomberg
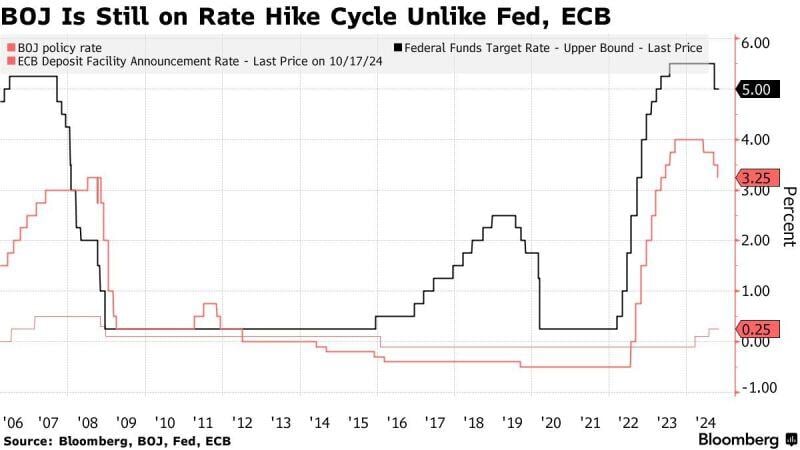
The BOJ kept interest rates steady on Thursday
The BOJ roughly maintained its forecast that inflation will hover near its 2% inflation target in coming years, signaling its readiness to continue rolling back its massive monetary stimulus. The Yen climbed as much as 0.9% on Ueda comments.
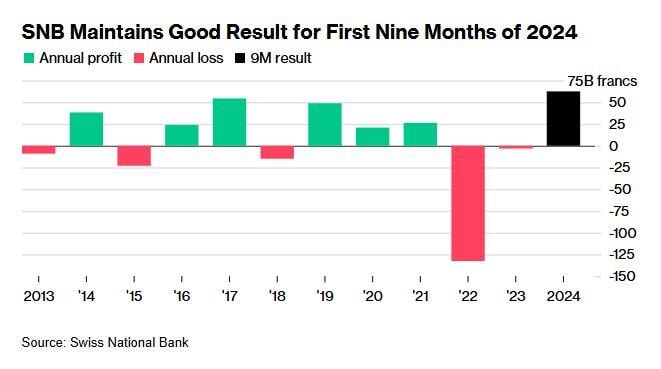
The Swiss National Bank made a solid nine-month profit on rising equities, bonds and gold prices, increasing the chances for a restart of profit distributions after a two-year break.
Switzerland’s central bank notched up a gain of 62.5 billion francs ($72 billion) for the first nine months of the year, it said on Thursday. Although the strong franc ate into the results, the SNB extended its profit during the July-September period. Source: Bloomberg
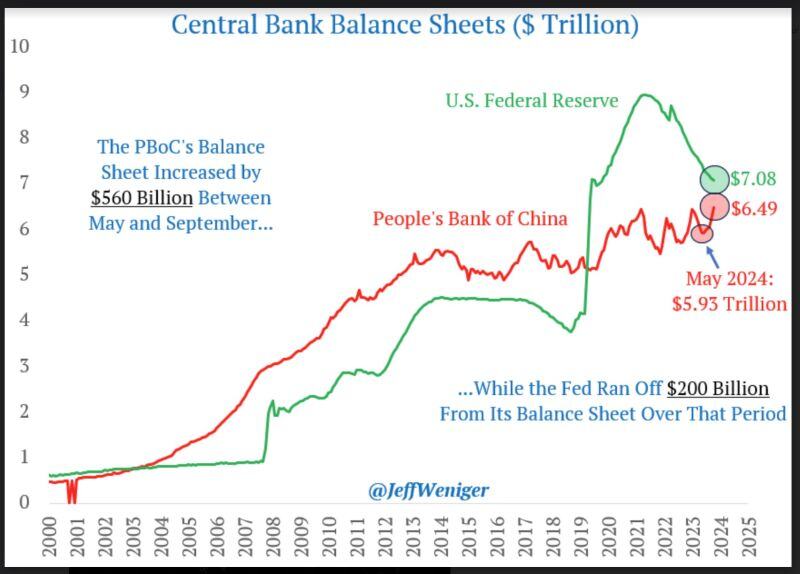
👉 A very important chart about global liquidity...
While the fed is still in qt mode (it has decreased the size of its balance sheet by $200B between May and September), the PBOC is in qe mode having increased its balance sheet by $560B between May and September... Ne-net liquidity is increasing. With global central banks cutting rates at the most aggressive pace since the pandemic and with the PBOC expanding the size of its balance sheet almost 3x more than the Fed is reducing it, it will be interesting to see the consequences on inflation + on gold, silver, etc. Source chart: Jeff Weniger
Investing with intelligence
Our latest research, commentary and market outlooks


