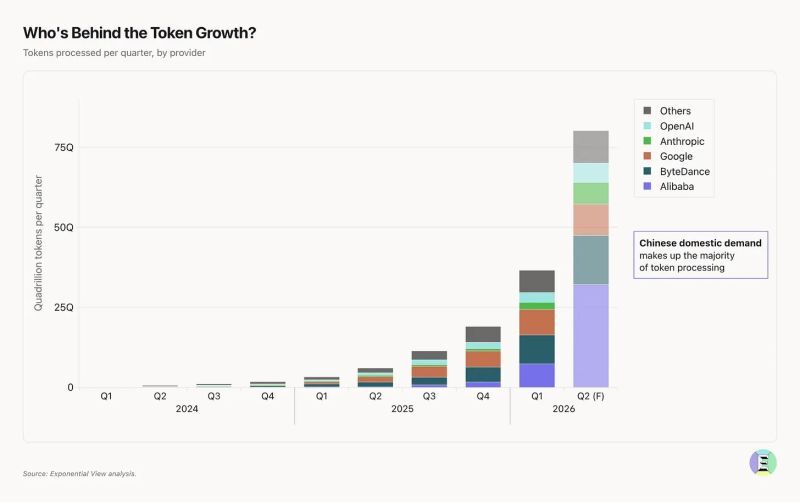
The number of tokens processed per quarter has grown by about 17,000x over four years.
Chinese domestic demand accounts for most of that growth. Source: Azeem Azhar
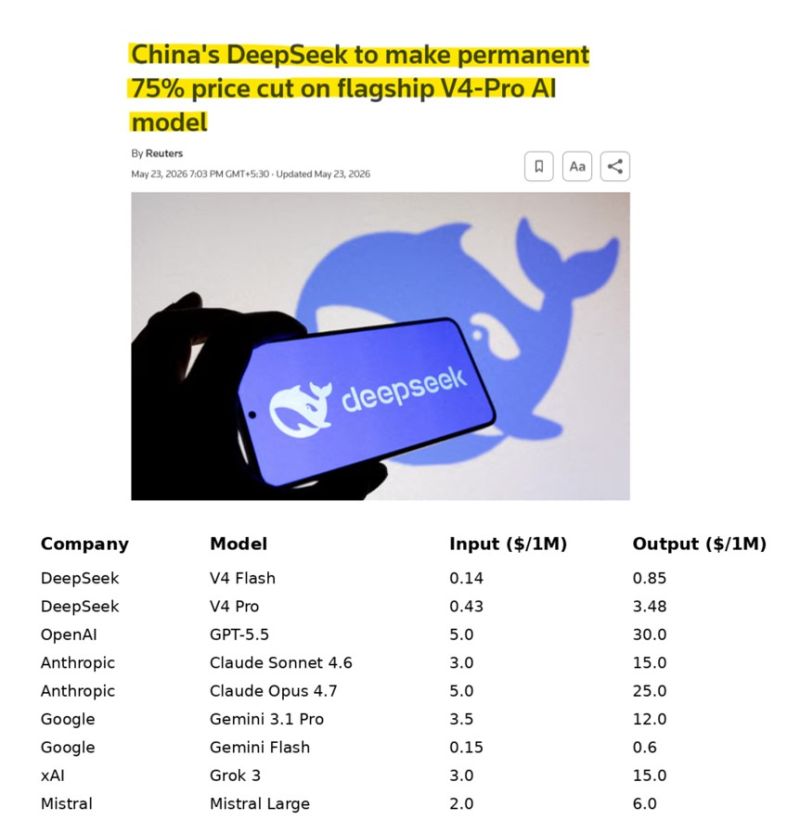
DeepSeek is now up to 50x CHEAPER than OpenAI and Anthropic for AI tokens.
DeepSeek’s massive price cuts have made its AI token costs up to 50x cheaper than OpenAI and Anthropic, reshaping enterprise AI economics. Since hashtag#AI costs scale with token usage, companies running coding agents or reasoning-heavy models can spend millions—or even billions—annually. More advanced models consume huge hidden “reasoning” tokens, dramatically increasing compute costs. This is pushing firms toward cheaper, optimized models and tools, with companies like Microsoft and Uber already feeling budget pressure. The key competitive advantage in AI may shift from having the smartest model to delivering “good enough” AI at the lowest scalable cost. Source: Bull Theory
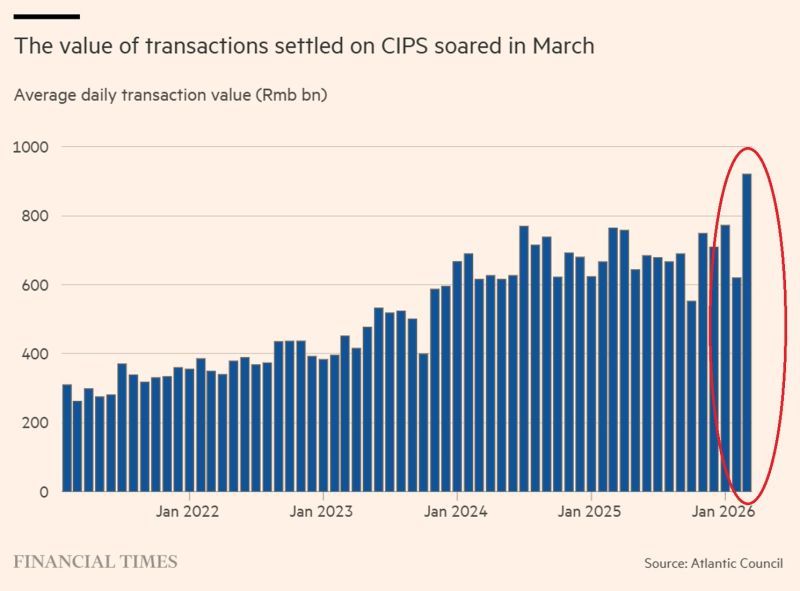
The Iran war is accelerating the rise of the Chinese yuan in global trade:
China’s Cross-Border Interbank Payment System (CIPS) has grown rapidly, with daily transactions rising from about 300 billion yuan in 2021 to a record 920 billion yuan in March 2026, briefly peaking at 1.22 trillion yuan in April. Created in 2015 as an alternative to Western payment networks, CIPS is increasingly used by sanctioned countries like Russia and Iran for energy trade. Saudi Arabia is also expanding renminbi-based oil transactions with China, boosting “petroyuan” speculation, though the US dollar still dominates global oil trade.
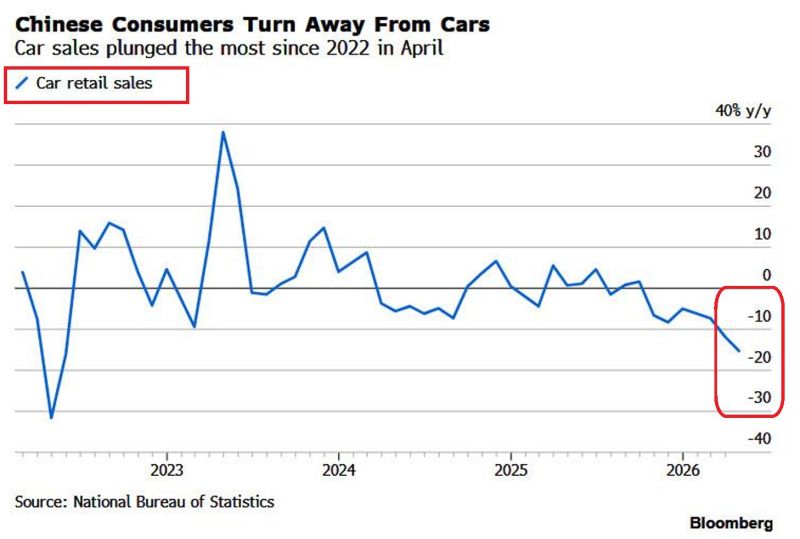
What is happening in China?
Car retail sales plunged -15% YoY in April, the steepest decline since mid-2022, according to China's National Bureau of Statistics. Home appliance and furniture purchases fell at a double-digit pace, while gold, silver, and jewelry sales collapsed -21% YoY. Overall retail sales rose just +0.2% YoY in April, the weakest reading since December 2022, while fixed-asset investment fell -1.6% in the first 4 months of 2026, returning to contraction. The April data suggest GDP could expand as little as +4.1% YoY in Q2 2026, which would represent a significant miss of Beijing's official growth target of 4.5% to 5% China's economy is struggling. Source: Global Markets Investor
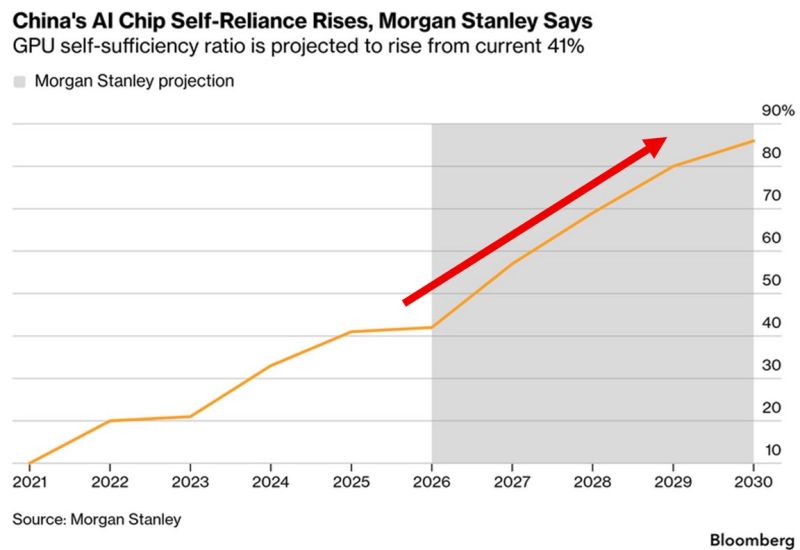
China is moving fast to replace foreign AI chips with domestic ones:
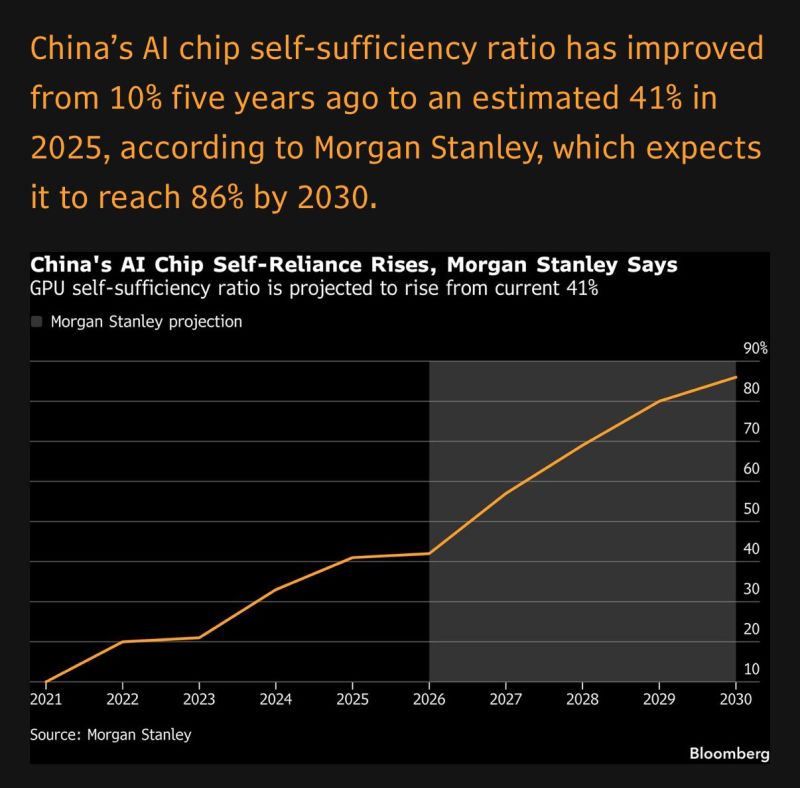
China's AI chip self-sufficiency ratio has risen from ~10% in 2021 to 41% in 2026, a more than 4 times increase in just 5 years, per Morgan Stanley. This ratio shows how much of China’s AI chip demand is filled by local production instead of imports. Morgan Stanley projects this ratio will rise further to ~86% by 2030, meaning China could meet nearly all of its AI chip demand domestically within 4 years. US export restrictions have accelerated China's push to develop domestic alternatives, and the results are advancing faster than most of the world expected. Source: Global Markets Investor
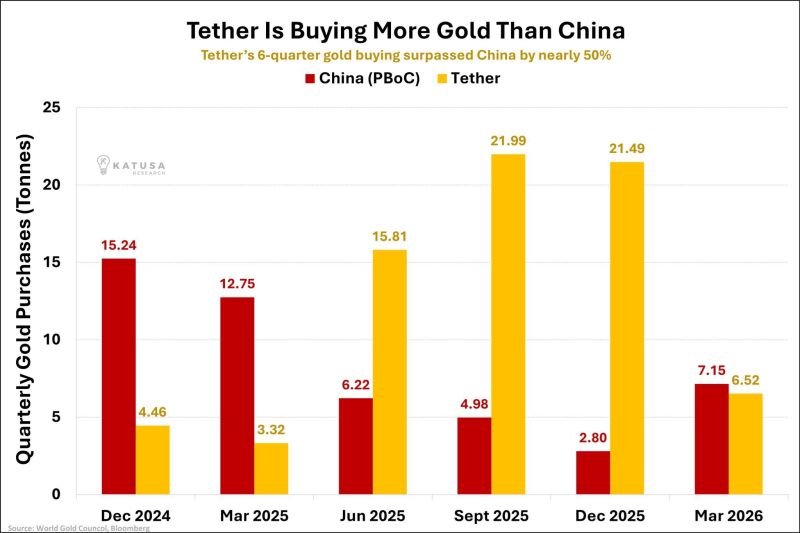
Tether is accumulating gold at a pace that rivals central banks
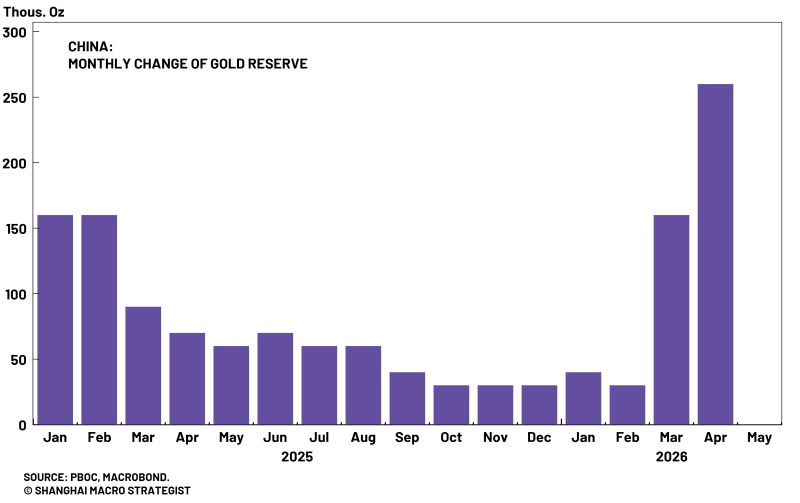
Tether purchased 6.5 tonnes of gold in Q1 2026, bringing total holdings to a record 132 tonnes. Over the last 6 quarters, Tether has purchased ~73 tonnes of gold in total, surpassing China's central bank purchases of ~49 tonnes over the same period by nearly +50%. Tether's gold holdings have more than DOUBLED over the last 12 months. In 2025, Tether acquired more gold than every central bank except Poland. Tether is now competing directly with central banks for gold. Source: Global Markets Investor
China will go from being almost completely reliant on chips from external sources to almost completely self-sufficient in just ten years - per MS
Source: David Ingles
The Chinese central bank remains the most unwavering “buy-the-dip” force in gold.
Source: Shanghai Macro Strategist