Straight from the Desk
Syz the moment
Live feeds, charts, breaking stories, all day long.
- All
- us
- macro
- equities
- Food for Thoughts
- sp500
- Central banks
- Bonds
- markets
- bitcoin
- Asia
- technical analysis
- investing
- europe
- Crypto
- geopolitics
- tech
- gold
- performance
- Commodities
- AI
- nvidia
- ETF
- earnings
- Forex
- Real Estate
- oil
- banking
- Volatility
- nasdaq
- magnificent-7
- apple
- emerging-markets
- energy
- Alternatives
- china
- switzerland
- trading
- tesla
- sentiment
- russia
- Money Market
- assetmanagement
- UK
- ESG
- Middle East
- amazon
- ethereum
- meta
- microsoft
- bankruptcy
- Healthcare
- Industrial-production
- Turkey
- Global Markets Outlook
- africa
- brics
- Market Outlook
- Asset Allocation Insights
- Flash
- Focus
As highlighted in a post by Spencer Hakimian on X: The United States has a $66B 10 Year Bond from February 2015 coming due tomorrow.
It had a 2.00% fixed coupon. It is going to be replaced with another $66B 10 Year Bond, but this time, with a 4.55% fixed coupon. This one single rollover will add an extra $1.67B per year to the national debt for the next 10 years. Bond auctions like these are happening every single day. After a decade of ZIRP, all of that debt now costs taxpayer money. No surprise that gold and bitcoin have been going to the roof Soruce: Bloomberg, Spencer Hakimian on X:
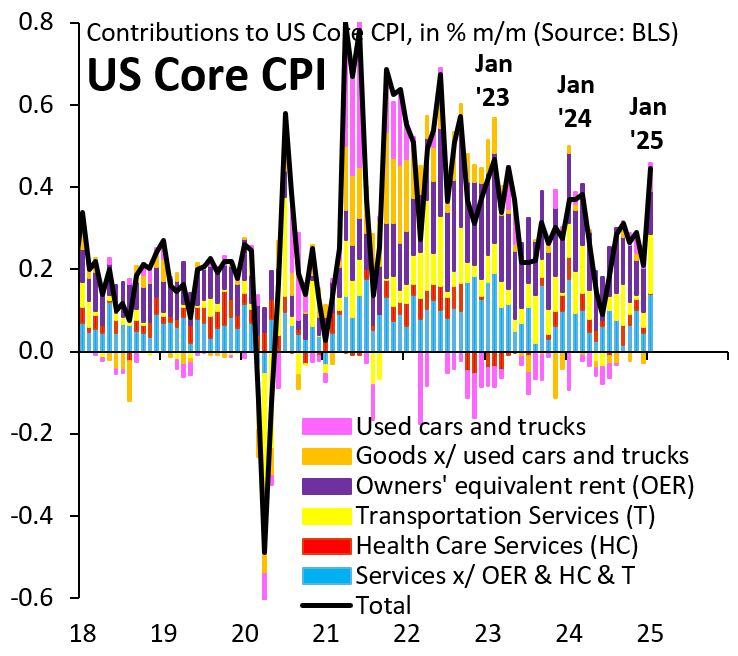
Ever since COVID, January inflation has come in "hot."
Today's core CPI is no different. A proxy for underlying inflation is "core" services (in blue on the chart below courtesy of Robin Brooks) and that looks well-behaved. So it could be that this "hot" reading is largely about noise and residual seasonality, as in 2023 and 2024... Source: Robin Brooks
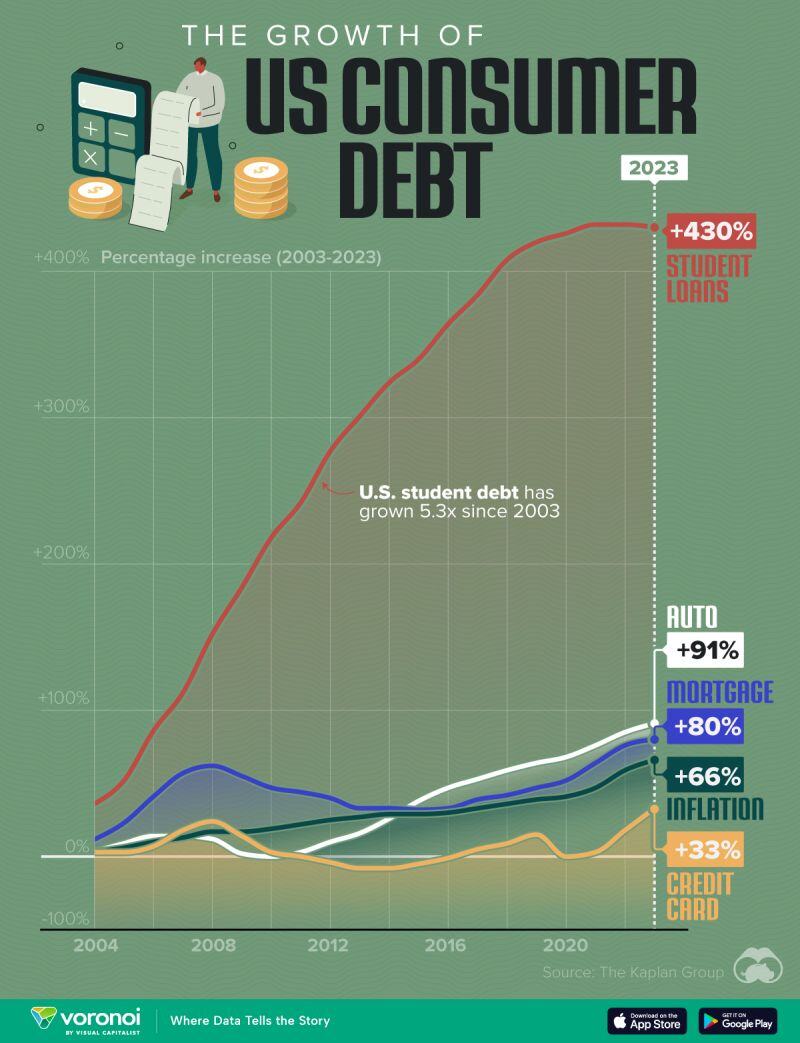
Visualizing the Growth of U.S. Consumer Debt
🚨 The Kaplan Group analyzed the State Level Household Debt Statistics from 2003 to 2023, sourced from the Federal Reserve Bank of New York. Data were retrieved for auto loans, mortgages, credit cards, and student loans since 2003. The evolution of each of these elements over the last 20 years was calculated. For inflation, the Consumer Price Index (CPI) was utilized. 👉 Key Takeaways - Student loan debt is five times larger than it was 20 years ago - Credit card debt has shown minimal growth since 2023; from 2010 to 2016, it was even lower than in 2003 - The total amount of debt has grown by 81.5% since 2003 Source: Visual Capitalist, Voronoi
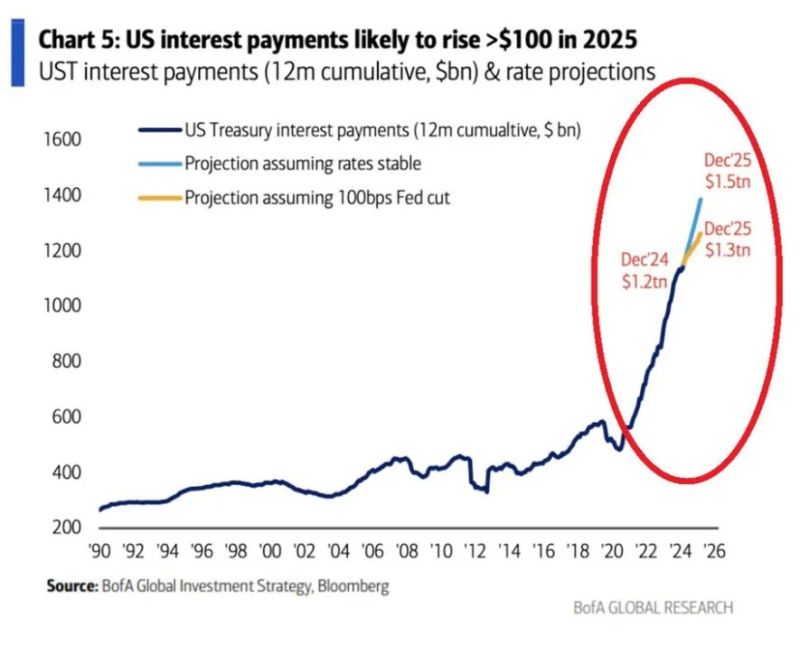
US Interest Costs Soar to $1.2 Trillion – Now Exceed Defense Spending
Over the last 12 months, US interest payments hit a record $1.2 trillion, surpassing defense spending ($900 billion) and now ranking as the second-largest government expense after Social Security. With trillions in debt maturing this year, the US government will have to refinance. If rates remain stable, total interest payments could skyrocket to $1.5 trillion by year-end. Even in a scenario where the Fed cuts rates by 100 bps (from 4.5% to 3.5%), interest costs are still projected to reach ~$1.3 trillion by the end of 2025. source : BofA
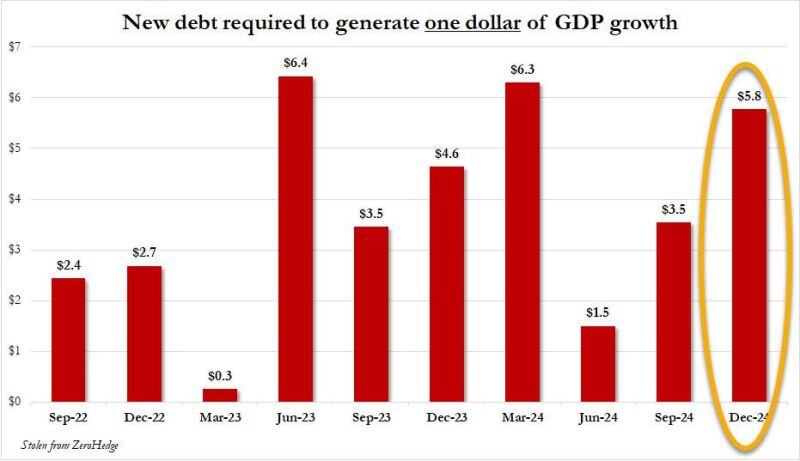
The US economy has been driven by a massive DEBT BUBBLE: In 2024, to generate 1 unit of GDP growth it took $3.8 of national debt...
In Q4 alone, it took $5.8 of debt to create $1 of economic growth. If not for the huge debt, the US economy would have been in a recession. Source: Global Markets Investor
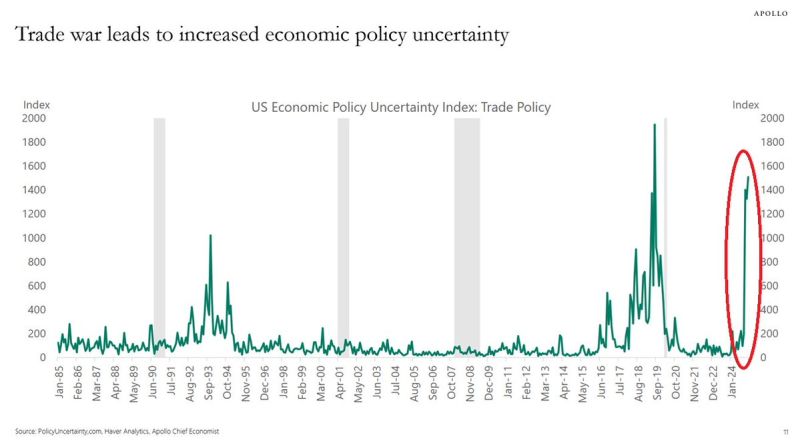
‼️US economy policy uncertainty is SPIKING:
This means economic environment will be challenging to predict and may impact investments and spending, as well as trigger more volatility in the markets. The index is only below the 2018 levels when the previous trade war took place. Source: Global Markets Investor
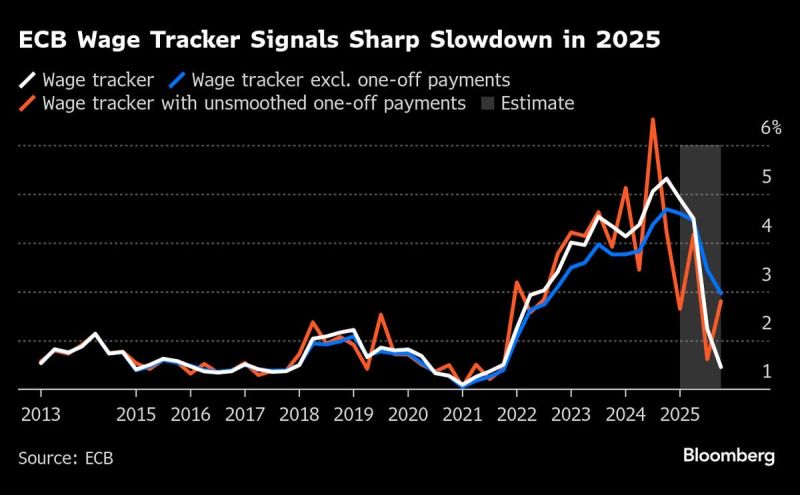
Cut cut cut...
ECB’s Wage Tracker Points to Steep Slowdown This Year - Bloomberg Source: Bloomberg
Investing with intelligence
Our latest research, commentary and market outlooks


