22 Mar 2024
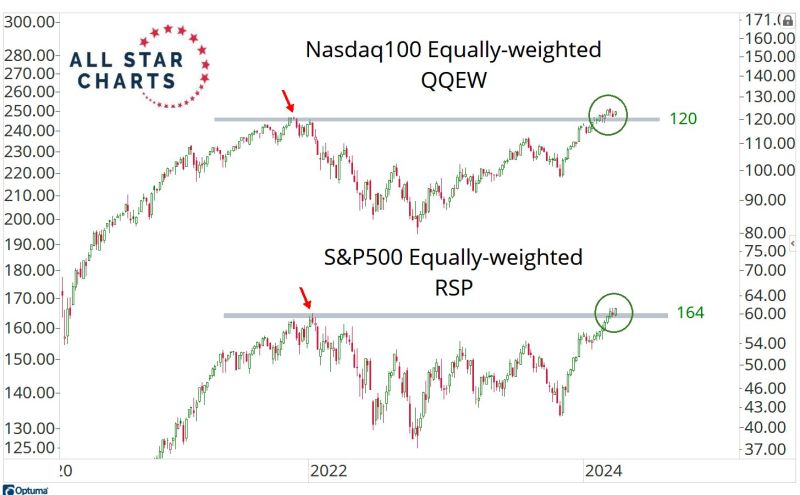
Here are the Equally-weighted Nasdaq100 and S&P500.
If these two are above their former cycle highs, it's hard to be too bearish on this market. Source: J-C Parets
15 Mar 2024
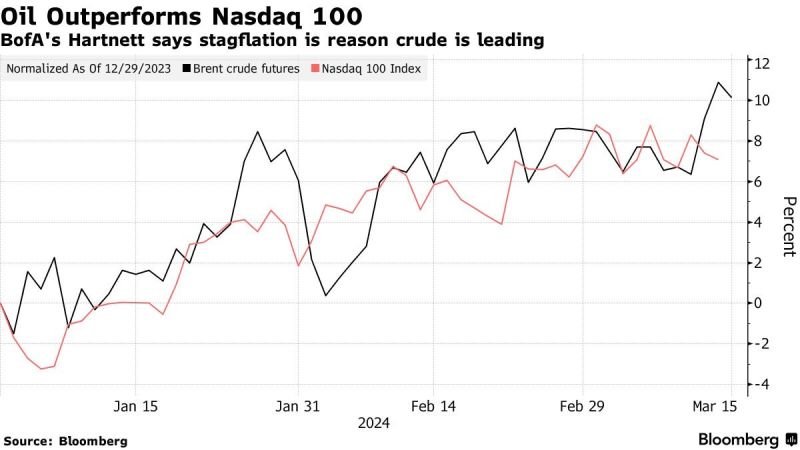
Believe it or not oil is outperforming the NASDAQ this year
Source: Bloomberg
27 Feb 2024
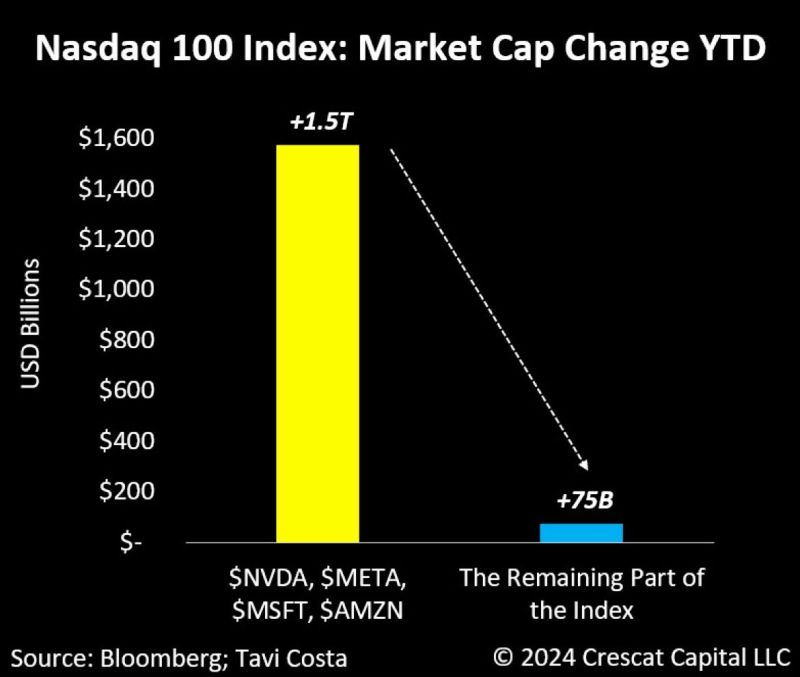
Four companies have accounted for over 90% of the market cap gains in the Nasdaq 100 this year.
Source: Bloomberg, Tavi Costa
26 Feb 2024
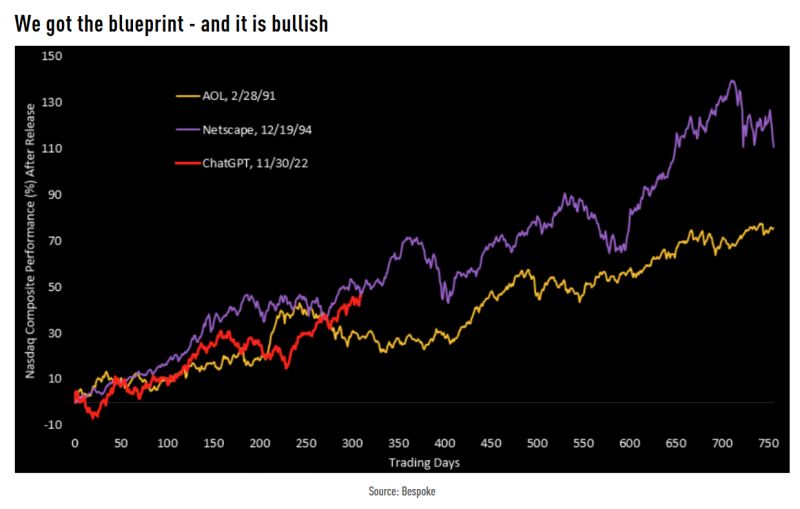
It's been 309 trading days since ChatGPT was released on 11/30/22 and the Nasdaq is up 46.07%.
In the 309 trading days after Netscape (the first web browser) was released in December 1994, the Nasdaq was up 45.9%. Source: TME
23 Feb 2024
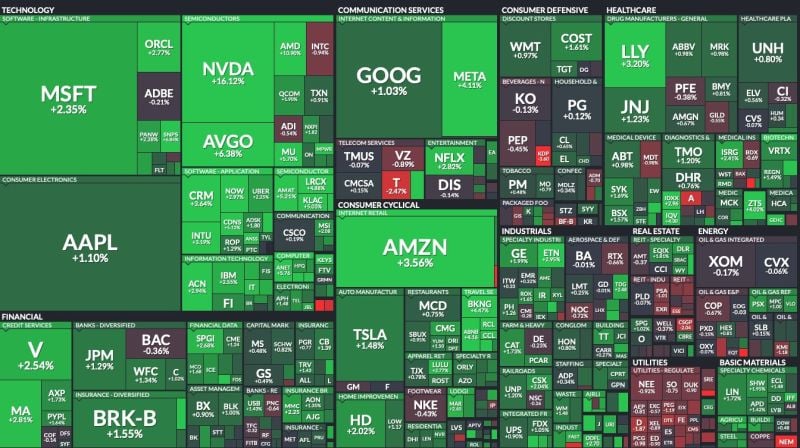
S&P, NASDAQ 100 & DJIA closed at RECORD HIGH
Source: Bloomberg
20 Feb 2024
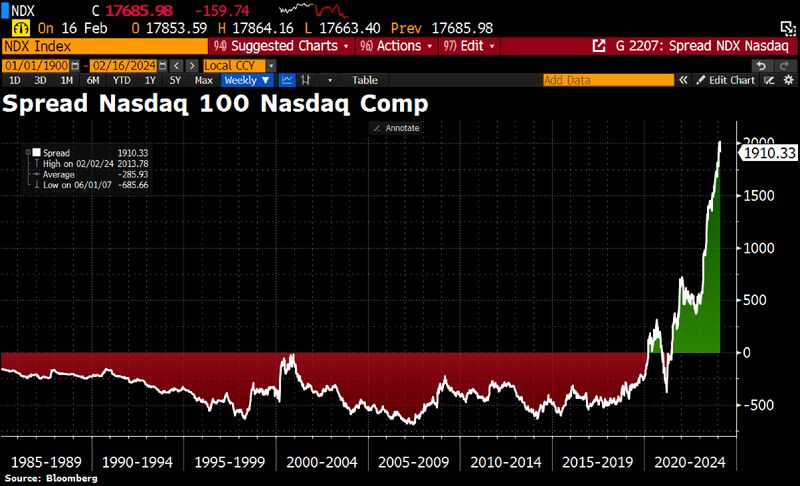
Big Tech Concentration in one chart
The spread of Nasdaq 100 over Nasdaq Composite is near ATH! Source: Bloomberg, HolgerZ
6 Feb 2024
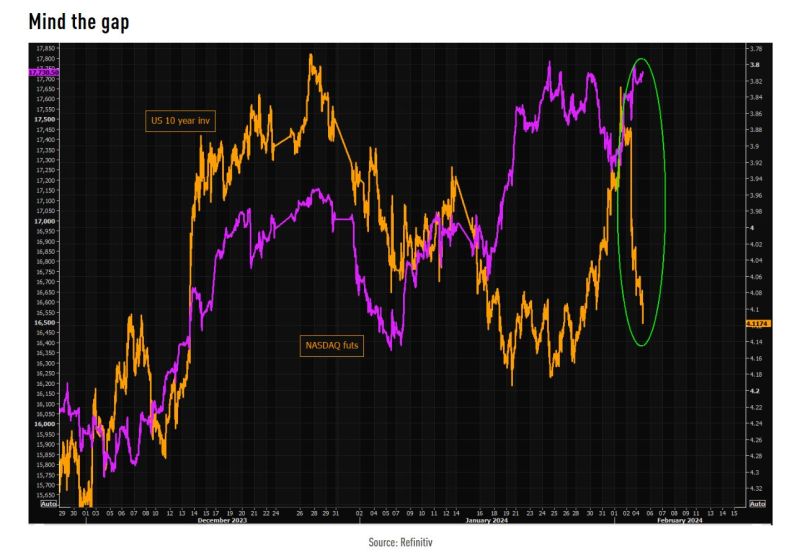
The short term gap is huge. NASDAQ futs vs US 10 year (inv), 10 min 3 mths chart.
Source: TME
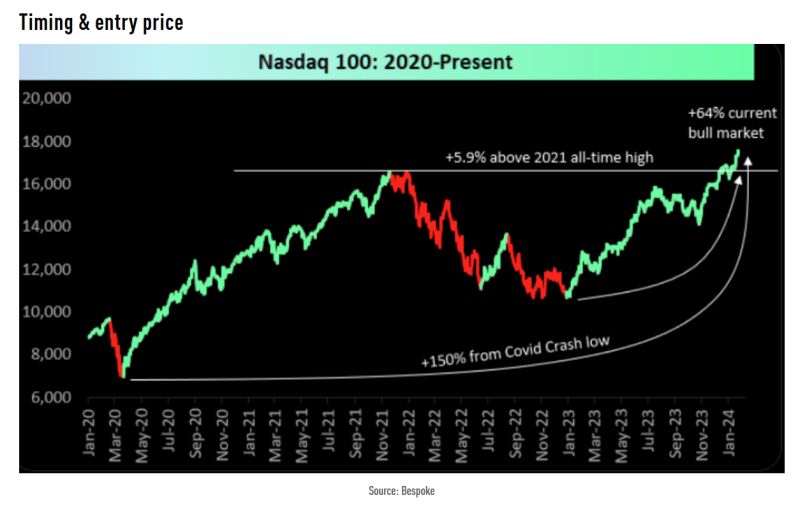
25 Jan 2024
The Nasdaq 100:
- if you bought at the December 2022 low, you are up 64% - if you bought at the 2021 high. you are up 5%. - if you bought at March 2020 lows, you are up 150% Source: Bespoke, TME