Straight from the Desk
Syz the moment
Live feeds, charts, breaking stories, all day long.
- All
- us
- macro
- equities
- Food for Thoughts
- sp500
- Central banks
- Bonds
- markets
- bitcoin
- Asia
- technical analysis
- investing
- europe
- Crypto
- geopolitics
- tech
- gold
- performance
- Commodities
- AI
- nvidia
- ETF
- earnings
- Forex
- Real Estate
- oil
- banking
- magnificent-7
- Volatility
- nasdaq
- apple
- emerging-markets
- energy
- china
- Alternatives
- switzerland
- tesla
- trading
- sentiment
- russia
- Money Market
- assetmanagement
- UK
- ESG
- Middle East
- microsoft
- amazon
- ethereum
- meta
- bankruptcy
- Turkey
- Healthcare
- Industrial-production
- Global Markets Outlook
- africa
- brics
- Market Outlook
- Asset Allocation Insights
- Flash
- Focus
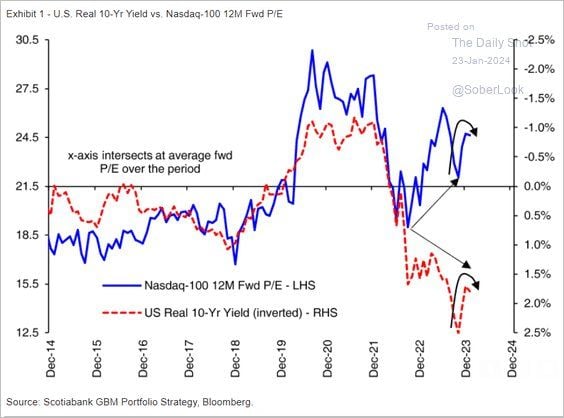
'The Nasdaq 100 valuation has disconnected from real rates.'
Source: The Daily Shot, Win Smart
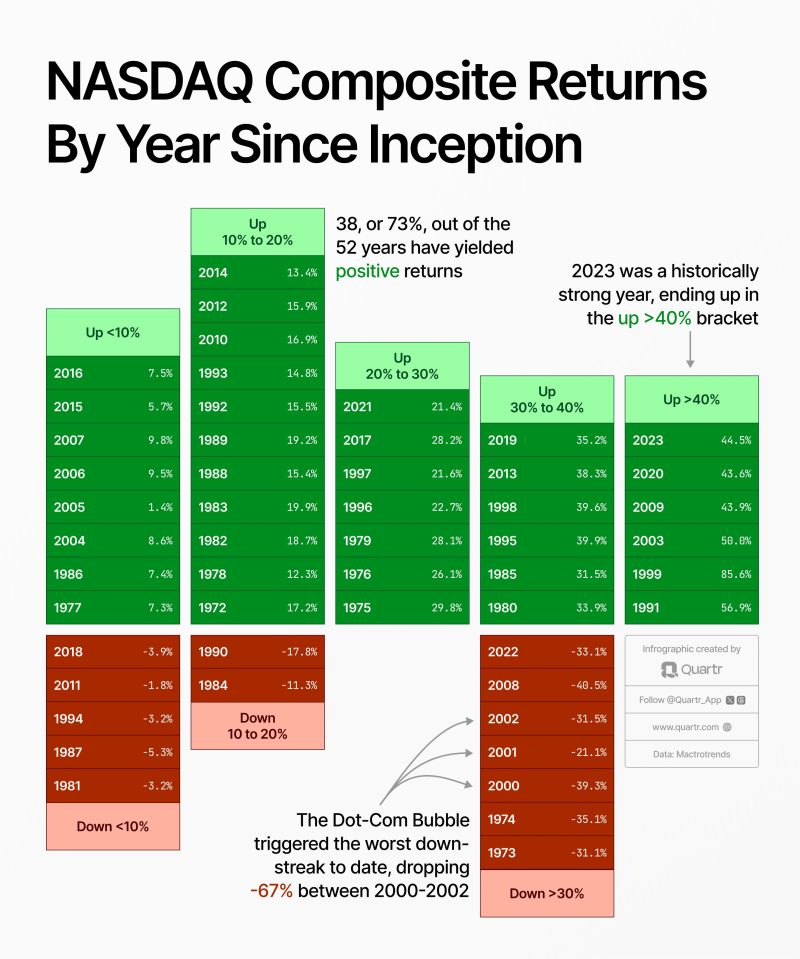
Fortune favors the patient investor. NASDAQ Returns By Year Since Inception
by Quartr
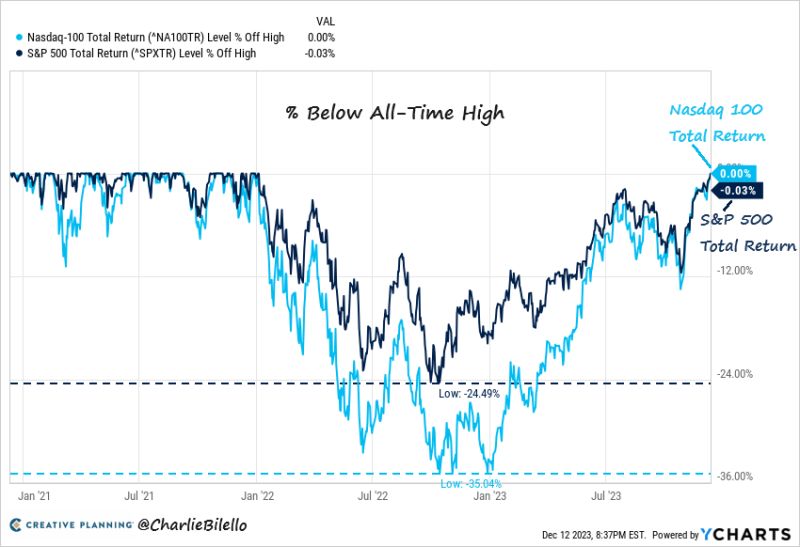
The Nasdaq 100 total return index closed at a new all-time high yesterday for the first time since December 27, 2021 (715 days)
S&P 500 total return index is 3 bps away from a new all-time closing high. Source: Charlie Bilello
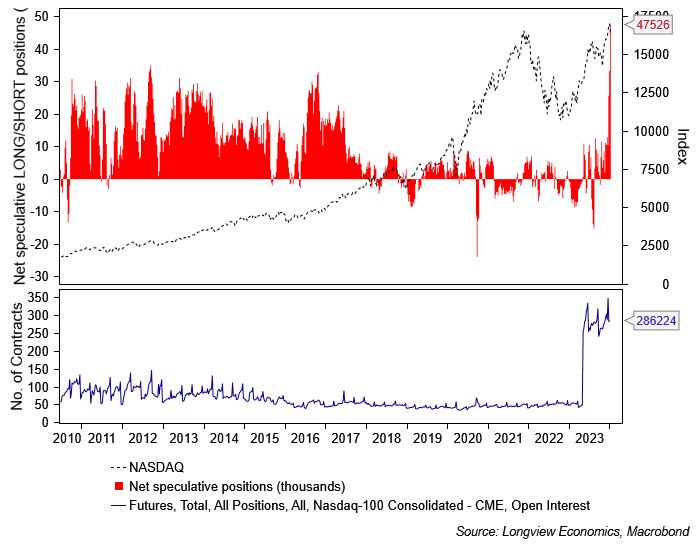
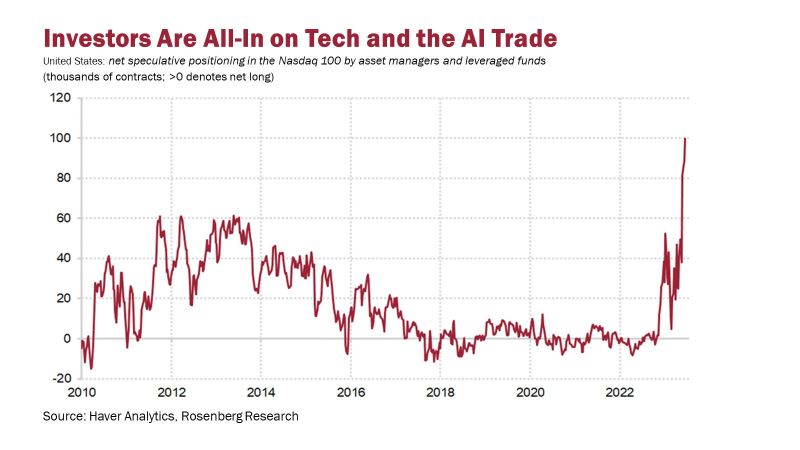
The net long positioning on the Nasdaq 100 by asset managers and leveraged funds is at a record high
When a trade becomes this crowded, how long until things reverse course? Source: Rosenberg Research
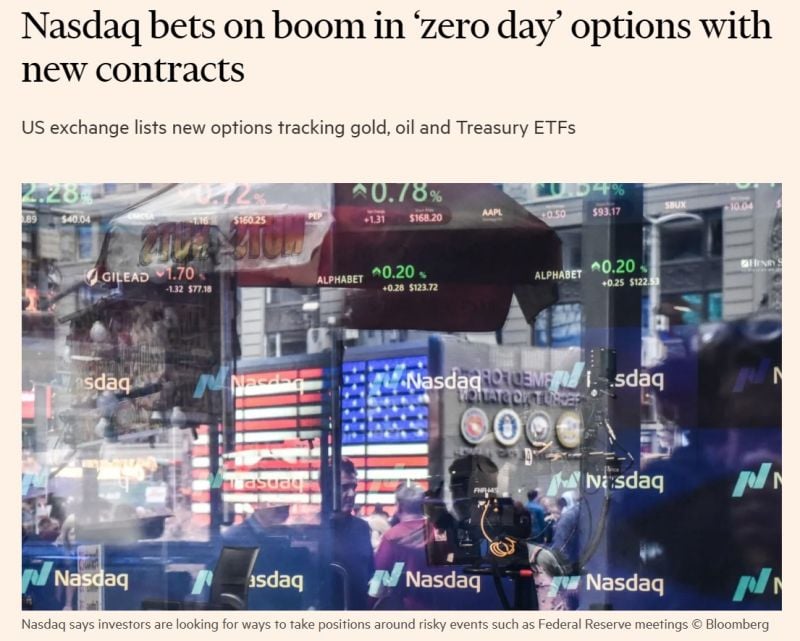
Nasdaq has now listed 0DTE Options (Zero Days to Expiry) for ETFS tracking silver, gold, oil, natural gas, and treasuries. Let the games begin! 🎰
Financial Times >>> "Trading in a controversial type of derivative known as “zero-day” options is spreading to Treasury and commodity markets, as Nasdaq and other exchange groups try to replicate a boom that has transformed trading in US stock indices. Nasdaq this week listed a series of new options contracts tracking some of the most popular exchange traded funds investing in gold, silver, natural gas, oil and long-term Treasuries. Options contracts give investors the right to buy or sell an asset at a fixed price by a given date. Trading a contract on the day it expires is known as zero-day trading and can be used to bet on or hedge against extremely short-term market moves. Zero-day trading in options tied to the S&P 500 index boomed in popularity during the coronavirus pandemic. Initially viewed as a temporary phenomenon driven by speculative retail traders, the surge sparked concern among some analysts and regulators that it could create systemic risk by exacerbating market moves. Source: FT, Barchart
Investing with intelligence
Our latest research, commentary and market outlooks

