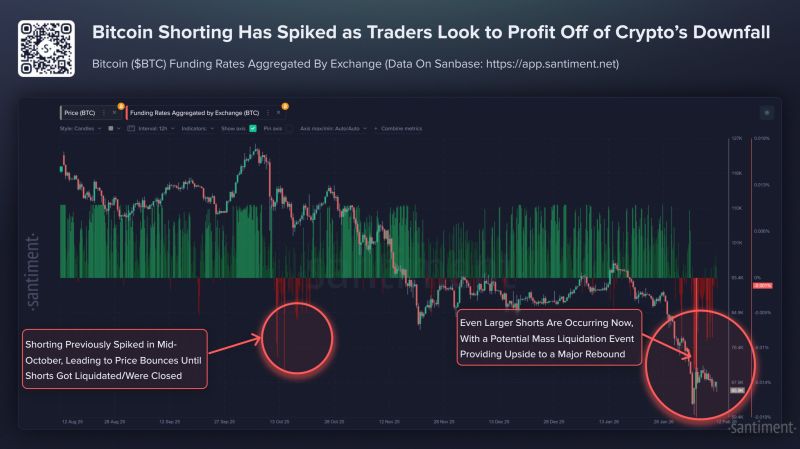
IS THE BOTTOM IN FOR BITCOIN? Aggregated data says "Squeeze Incoming
Aggregated data shows extremely negative Bitcoin funding rates, signaling overcrowded short positions. Historically, similar conditions preceded a market bottom and an 83% rally within four months. Negative funding means short sellers pay longs, increasing squeeze risk if prices rise. High leverage amplifies liquidation potential, forcing rapid buying. This imbalance reflects widespread fear and low confidence. Although not guaranteeing immediate gains, such extreme sentiment often creates conditions for reversals. Investors should remain patient, avoid emotional reactions, and monitor funding dynamics closely. Source: Santiment
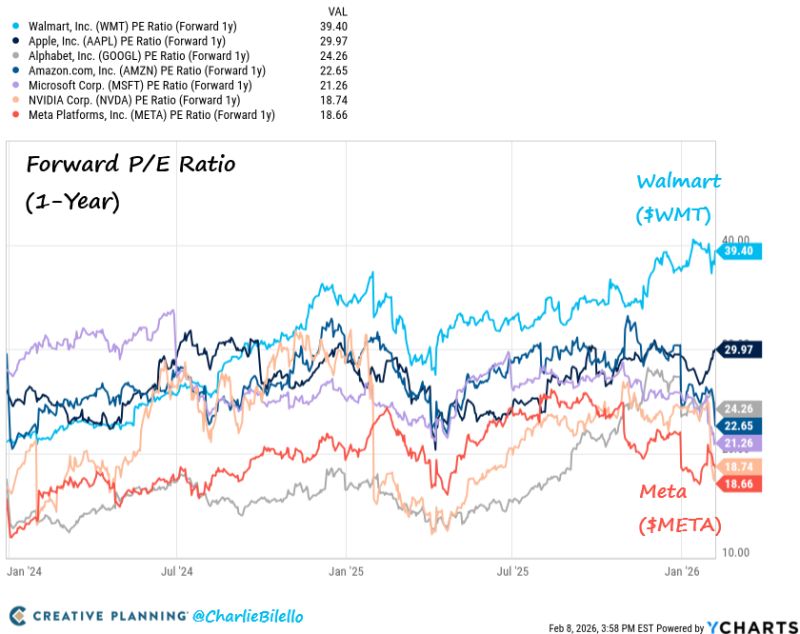
Who has the highest P/E among these mega caps? Answer: Wal-Mart $WMT...
Meta $META and Nvidia $NVDA are the cheapest, but if we factored in growth rates $NVDA is way cheaper than $META Source: Charlie Bilello
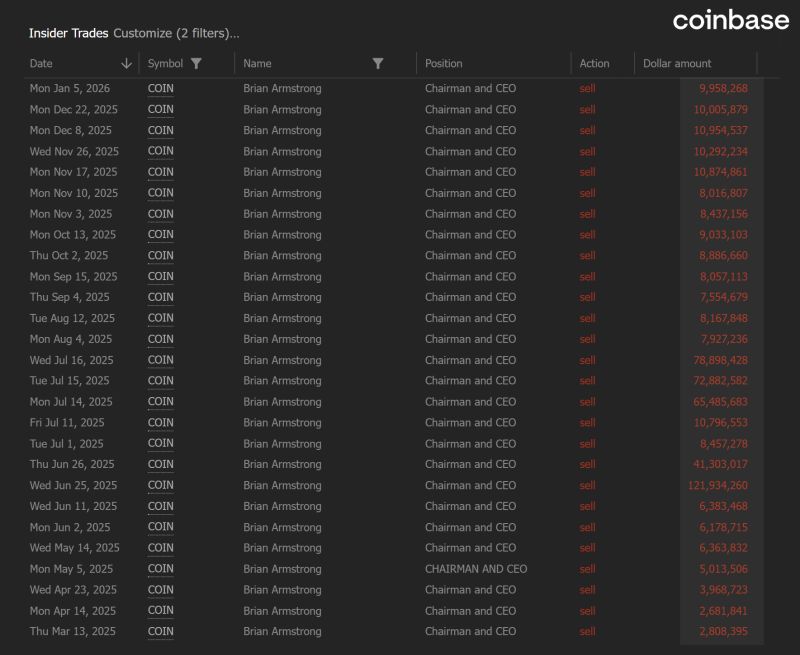
$COIN is now down -69% from its highs.
Over the past year, CEO Brian Armstrong has sold 1.5M shares, totaling $743M. Source: Trend Spider
The Trump Administration secretly smuggled 6,000 Starlink satellite terminals into Iran in January after the Iranian government cut off internet in the country, per WSJ.
Source: The Kobeissi Letter
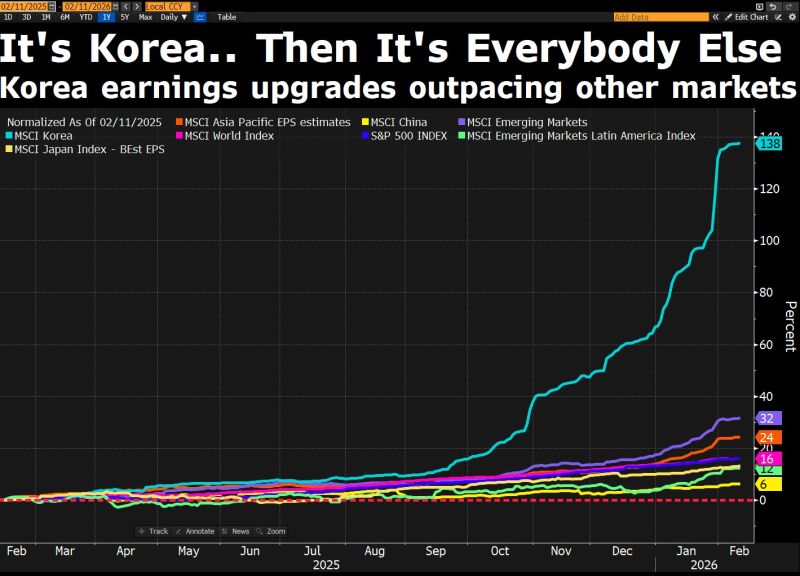
As far as the standout global earnings story is concerned, it's Korea... and then it's everybody else.
Source: David Ingles @DavidInglesTV
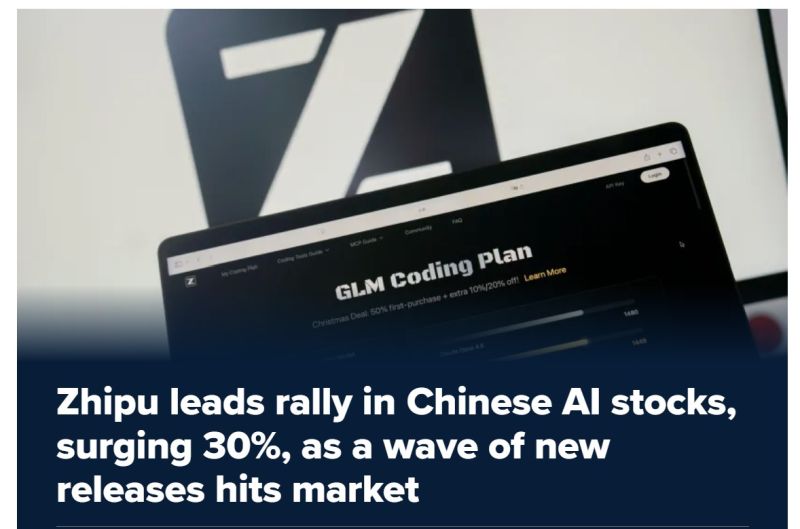
AI in China isn’t just "catching up"—it’s sprinting
China’s AI market is surging, fueled by government support and rapid innovation. Tech giants and startups like Zhipu AI and MiniMax are launching advanced models for coding and multimodal tasks, pushing the STAR AI Index up. The focus has shifted to agentic workflows and AI that can handle speech, visuals, and music, signaling a move beyond simple chat. With Premier Li Qiang calling for AI integration across all industries, China is narrowing the U.S. AI gap fast, making the global AI race more intense than ever. Source: CNBC
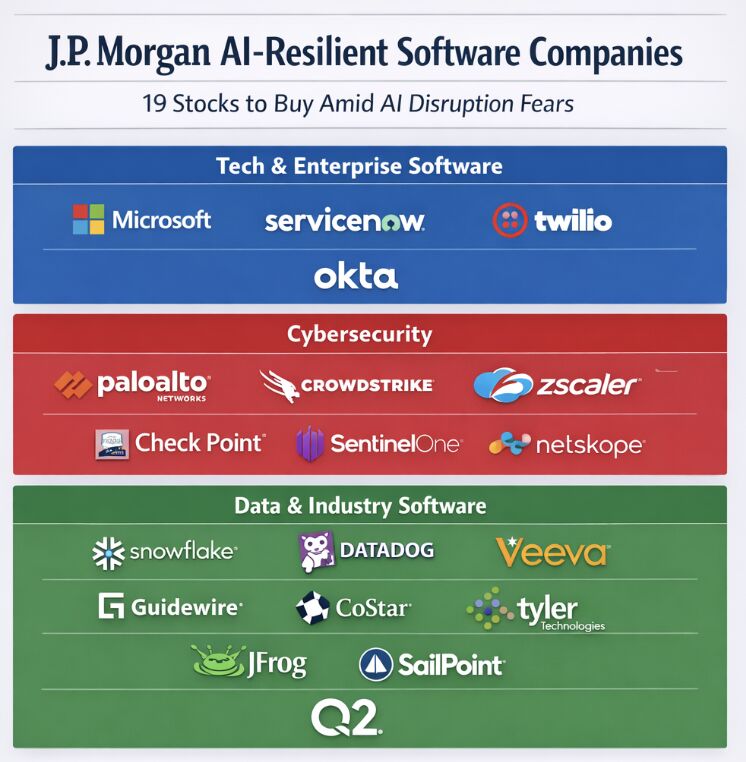
JP Morgan analysts just compiled a list of 19 software stocks that they believe 'are AI resistant'.
What do you think of their list? Source: Dividendology
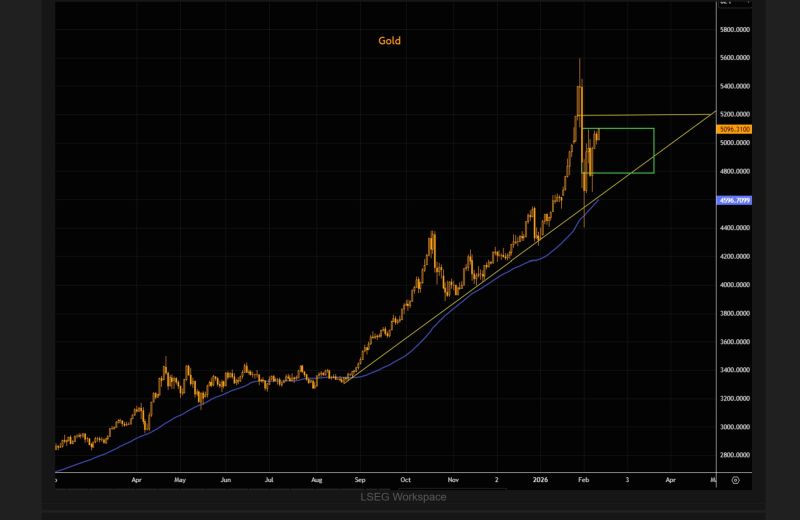
TME: "Gold bounced cleanly off the 50-day and the longer-term trend line.
We’re now trading at the highest levels since that bounce, hovering around the 50% retracement of the large down candle. So far, this has been a textbook rebound as positioning resets. gold likely needs more time to consolidate. $5,200 stands out as major resistance, while $4,800 marks key support". Source: TME