Straight from the Desk
Syz the moment
Live feeds, charts, breaking stories, all day long.
- All
- us
- equities
- Food for Thoughts
- macro
- sp500
- Bonds
- Asia
- bitcoin
- Central banks
- markets
- technical analysis
- investing
- inflation
- europe
- Crypto
- interest-rates
- Commodities
- geopolitics
- performance
- gold
- tech
- ETF
- nvidia
- AI
- earnings
- Forex
- Real Estate
- oil
- bank
- FederalReserve
- Volatility
- apple
- nasdaq
- emerging-markets
- magnificent-7
- energy
- Alternatives
- switzerland
- trading
- tesla
- sentiment
- Money Market
- russia
- assetmanagement
- china
- France
- UK
- ESG
- Middle East
- amazon
- ethereum
- microsoft
- meta
- bankruptcy
- Industrial-production
- Turkey
- Healthcare
- Global Markets Outlook
- brics
- recession
- africa
- Market Outlook
- Yields
- Focus
- shipping
- wages
The Nations SkewDex, which is a proxy of long put demand, reached the lowest level since data are recorded.
The Nations SkewDex compares the cost of out-of-the-money SPY put options to the cost of precisely at-the-money SPY options. Source: Bloomberg, C.Barraud
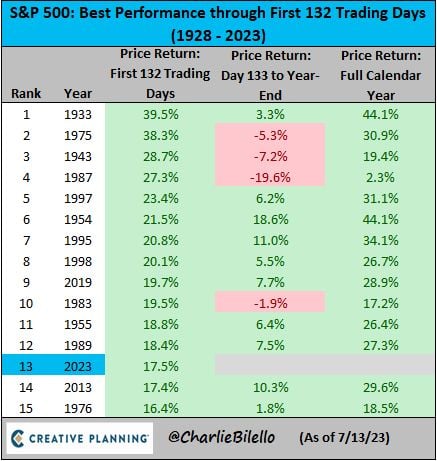
The S&P 500 is up 17.5% year-to-date. In the last 20 years only 2019 had a better start. $SPX
Source: Charlie Bilello
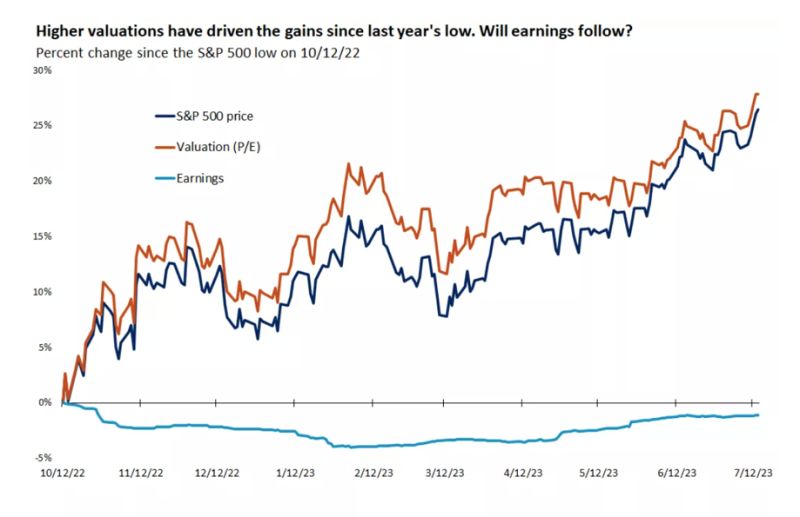
The S&P 500's 25% gain since last year's low has been driven by valuation expansion rather than rising earnings
The S&P 500's 25% gain since last year's low has been driven by valuation expansion rather than rising earnings. There is hope that earnings will start recovering in Q3 and through 2024. Source: Edward Jones
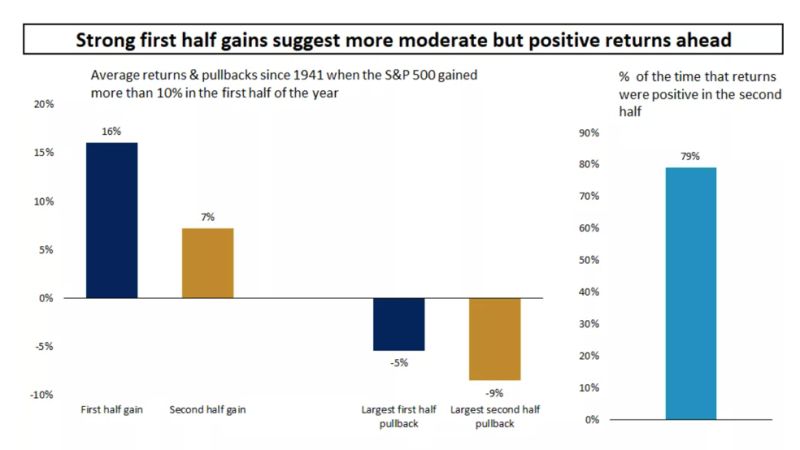
Since 1941 strong first half S&P 500 performance has been associated with further gains in the second half of the year, though with more volatility
Since 1941 strong first half S&P 500 performance has been associated with further gains in the second half of the year, though with more volatility. Past performance does not guarantee future results... Source: Edward Jones
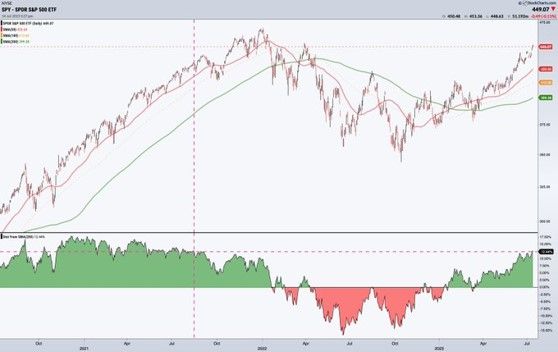
The S&P 500 is currently trading ~12.5% above its 200-day Moving Average
The S&P 500 is currently trading ~12.5% above its 200-day Moving Average. We haven't seen $SPY this far above its 200-day since August of 2021, nearly two years ago. While it looks over-extended, it is not unsustainable. For instance, study the left side of the chart from Nov '20 - Aug '21 Source: Grayson Roze
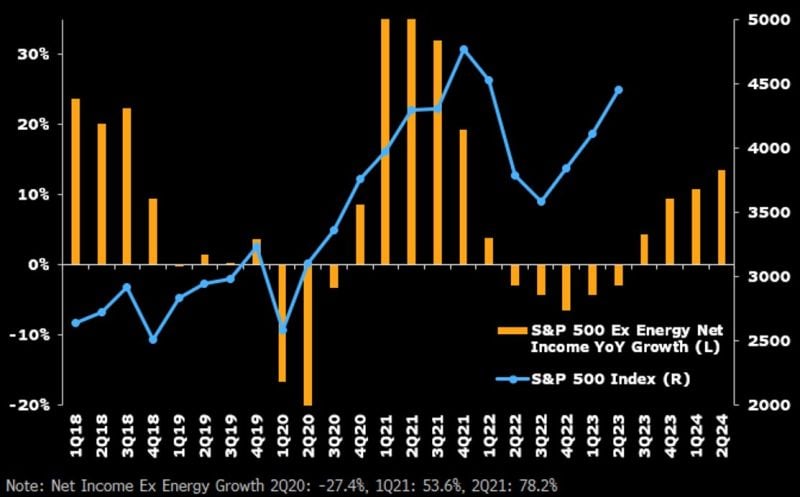
The sp500 has been anticipating the improvement in earnings (ex-Energy) expectations so far. Can these expectations be met?
Source: Bloomberg (Gina Martin Adams for the #chart)
Investing with intelligence
Our latest research, commentary and market outlooks


