Straight from the Desk
Syz the moment
Live feeds, charts, breaking stories, all day long.
- All
- us
- equities
- Food for Thoughts
- macro
- Bonds
- sp500
- Asia
- Central banks
- markets
- bitcoin
- technical analysis
- investing
- inflation
- interest-rates
- europe
- Crypto
- Commodities
- geopolitics
- performance
- gold
- ETF
- AI
- nvidia
- tech
- earnings
- Forex
- Real Estate
- oil
- bank
- Volatility
- nasdaq
- FederalReserve
- apple
- emerging-markets
- magnificent-7
- Alternatives
- energy
- switzerland
- sentiment
- trading
- tesla
- Money Market
- russia
- France
- ESG
- UK
- assetmanagement
- Middle East
- microsoft
- ethereum
- meta
- amazon
- bankruptcy
- Industrial-production
- Turkey
- china
- Healthcare
- Global Markets Outlook
- recession
- africa
- brics
- Market Outlook
- Yields
- Focus
- shipping
- wages
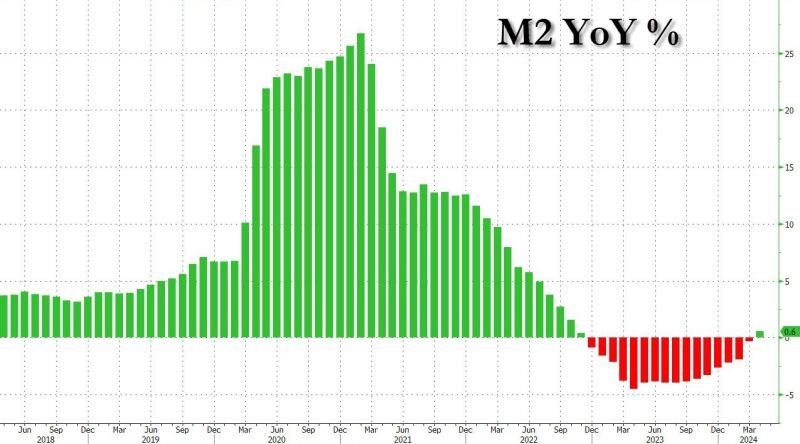
M2 is now positive in the US (with rates at 5.5%). Are rate cuts, QE and YCC just a matter of time?
Source: www.zerohedge.com, Bloomberg
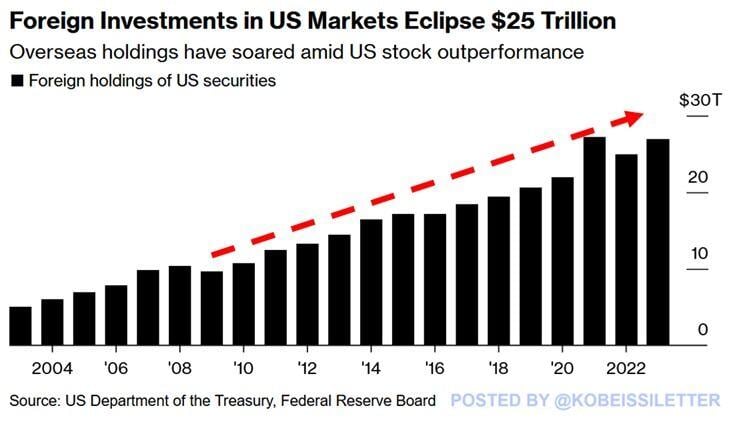
Foreign investors are piling into US markets:
Foreign holdings of US securities have hit ~$27 trillion in 2023, near the all-time highs seen in 2021. Since 2009, foreign investments in US markets have skyrocketed by 180%. This comes after the S&P 500 has gained 573% during this time materially outperforming other markets such as the EU, Canada, and Japan. Meanwhile, foreign investors’ share of the $78 trillion US equity market has risen to ~17%, an all time record. Source: Bloomberg, The Kobeissi Letter
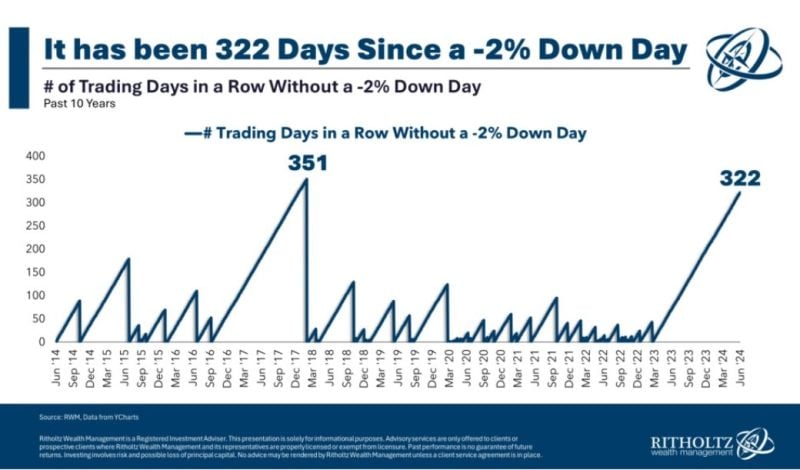
It has been a very quiet year so far for US equity markets...
No down day > 2% for the SP500 despite Middle East conflict, China doing military exercises around Taiwan, Fed interest rates cuts expectations moving from 6 to less than 2, etc. Source chart: Ritholtz
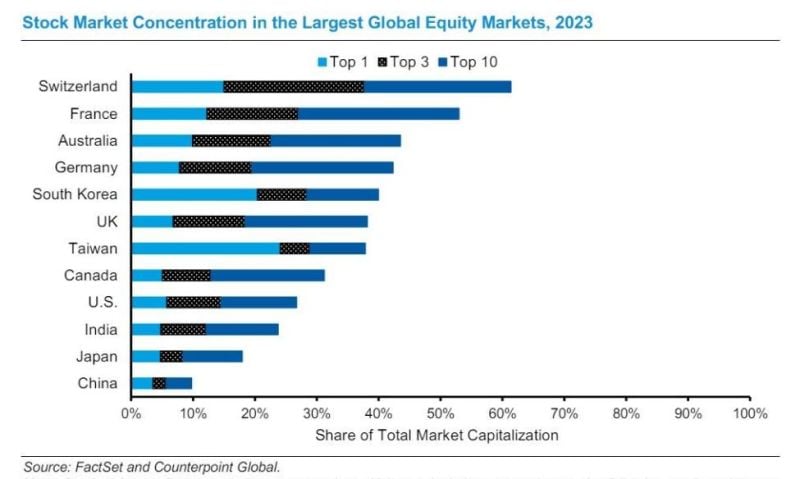
What US stock market concentration? Exhibit below
courtesy of Morgan Stanley and Factset - shows the market concentration at the end of 2023 for a dozen of the largest markets around the world. The U.S. is the fourth MOST DIVERSIFIED market notwithstanding the recent increase in concentration...
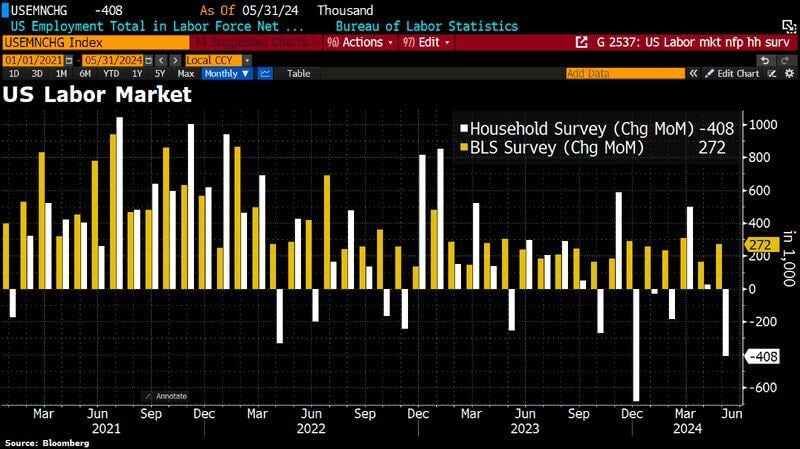
US employment data are out - here we go again with jobs numbers that don't add up...
here we go again with jobs numbers that don't add up... The Establishment survey by BLS reports 272k new jobs for May, smashing estimates (+185K consensus) and much strong than April (+165K). The labor market continues to show signs of resiliency in the face of higher Fed interest rates. This seems to decrease the odds that the hashtag#Fed could cut rates in September... BUT: - Labor force shrank: This is why the US unemployment rate has risen from 3.9% to 4% (first month with 4.0%+ unemployment since February 2022) despite a lower labor participation rate (Indeed, the labor supply as week, and as Unemployment Rate = Number of unemployed / labor force, a weak labor force implies higher unemployment rate despite rise in job creation). - Wage growth surprised to the upside: this could be linked to a reduction in the supply of labor which might be causing some bottlenecks given the still-robust job creation. Wage growth continues to remain a sticky source of inflation, rising at a 4.1% pace, which is still way too hot for the Fed. - The Household survey shows a large drop in the number of employed, down 408k jobs (see white bar below). - Full time jobs actually SHRUNK by 625k (This is the biggest drop in full-time employment since December 2023) while part time jobs rose by 286k. - Between the household and establishment surveys, the numbers are retarded and unusable. This makes economic data analysis very difficult. Bottom-line: Key Takeaway: All things considered, the May jobs report does not point to imminent Fed rate cuts. The pickup in jobs growth supports the case that the resilient labor market remains strong, and the economy continues to hold up better than expected. Source: Bloomberg
Investing with intelligence
Our latest research, commentary and market outlooks


