Straight from the Desk
Syz the moment
Live feeds, charts, breaking stories, all day long.
- All
- us
- equities
- Food for Thoughts
- macro
- Bonds
- sp500
- Asia
- Central banks
- markets
- bitcoin
- technical analysis
- investing
- inflation
- interest-rates
- europe
- Crypto
- Commodities
- geopolitics
- performance
- gold
- ETF
- AI
- nvidia
- tech
- earnings
- Forex
- oil
- Real Estate
- bank
- Volatility
- nasdaq
- FederalReserve
- apple
- emerging-markets
- magnificent-7
- Alternatives
- energy
- switzerland
- sentiment
- trading
- tesla
- Money Market
- russia
- France
- ESG
- UK
- assetmanagement
- Middle East
- microsoft
- ethereum
- meta
- amazon
- bankruptcy
- Industrial-production
- Turkey
- china
- Healthcare
- Global Markets Outlook
- recession
- africa
- brics
- Market Outlook
- Yields
- Focus
- shipping
- wages
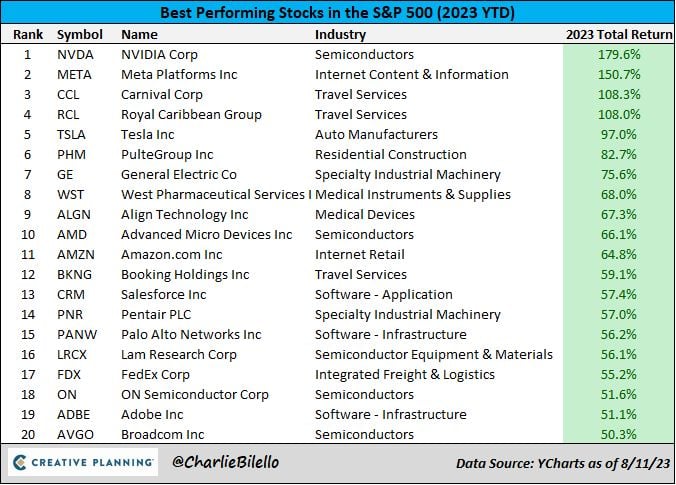
The best performance stocks in the S&P 500 this year...
Source: Charlie Bilello
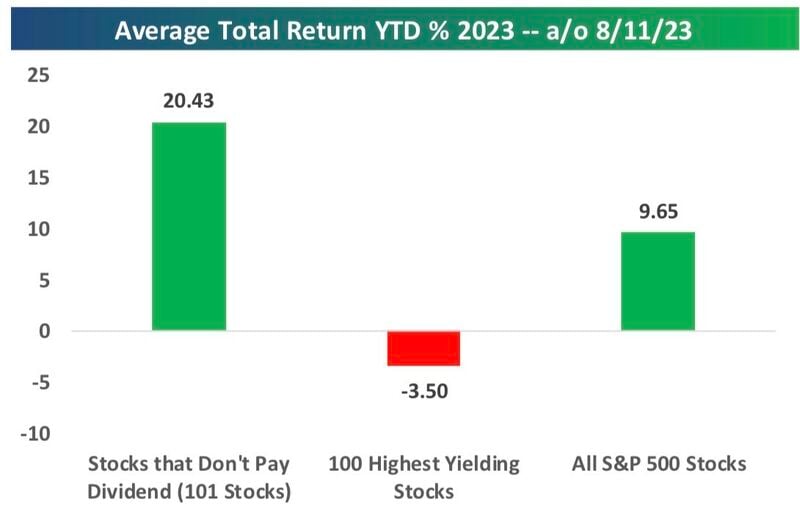
With “risk free” rates above 5%, the typically low-growth, high-dividend payers in the sp500 are massively underperforming in 2023
The 101 non-dividend payers are up 20.4% YTD, while the 100 highest yielders in the index are down an average of 3.5% on a total return basis. Source: Bespoke
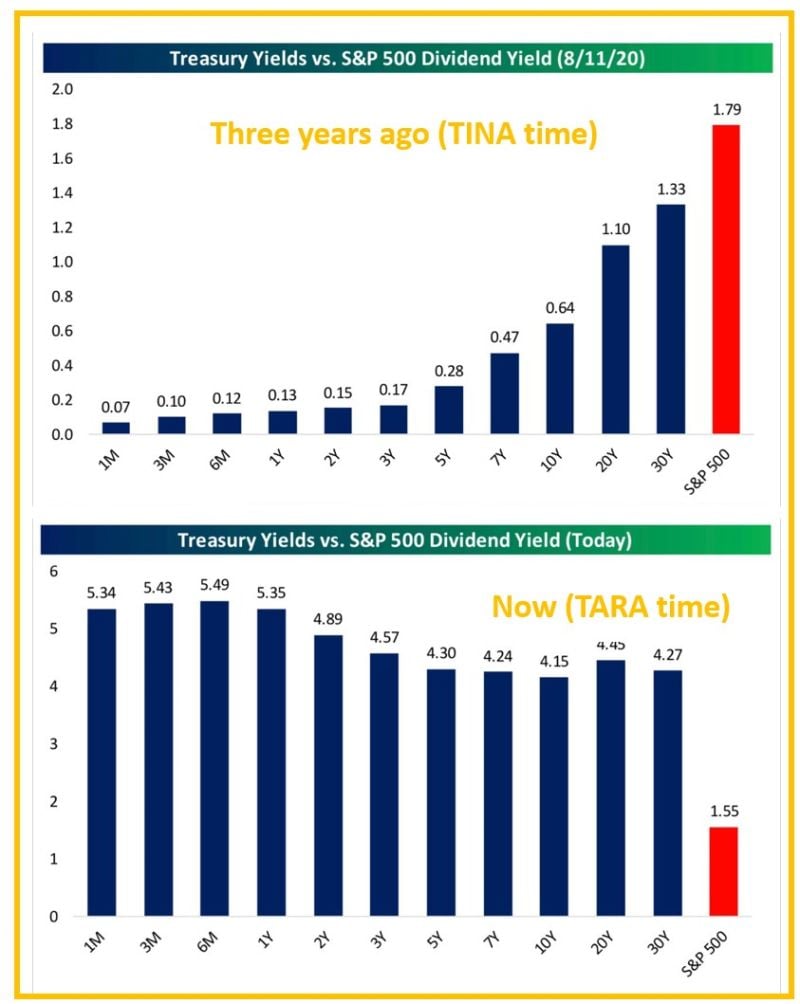
From T.I.N.A (There is No Alternatives to risk assets) to T.A.R.A (There Are Reasonable Alternatives, i.e bonds)
Three years ago in August 2020, the S&P’s dividend yield (in red below) was 1.8%, almost 50 bps higher than the highest yield on the treasury curve. Every treasury note with a duration shorter than 5 years had a yield below 0.2% and the 1-month was almost ZERO. Fast forward to today and the S&P’s dividend yield of 1.55% is 260 bps lower than the lowest point on the treasury curve right now (the 10-year at 4.15%). And the 1-month T-bill yielding at 5.34% is 380 basis points higher than the S&P’s dividend yield. Source: Bespoke
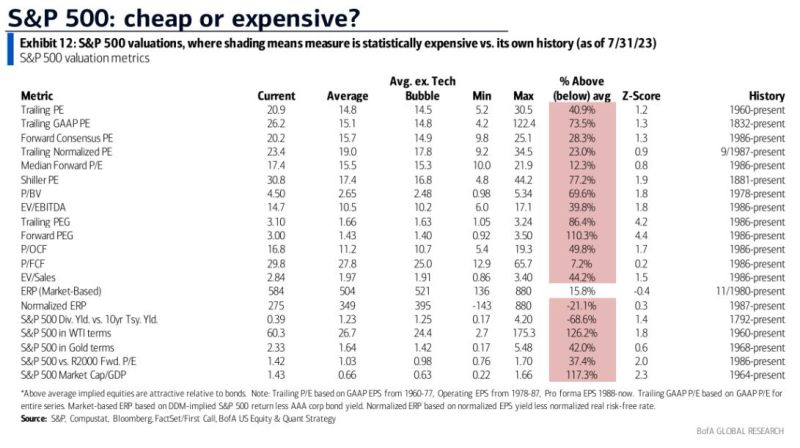
Out of 20 valuation metrics, the SP500 is currently overvalued on 19 of them relative to historical levels
Source: Barchart
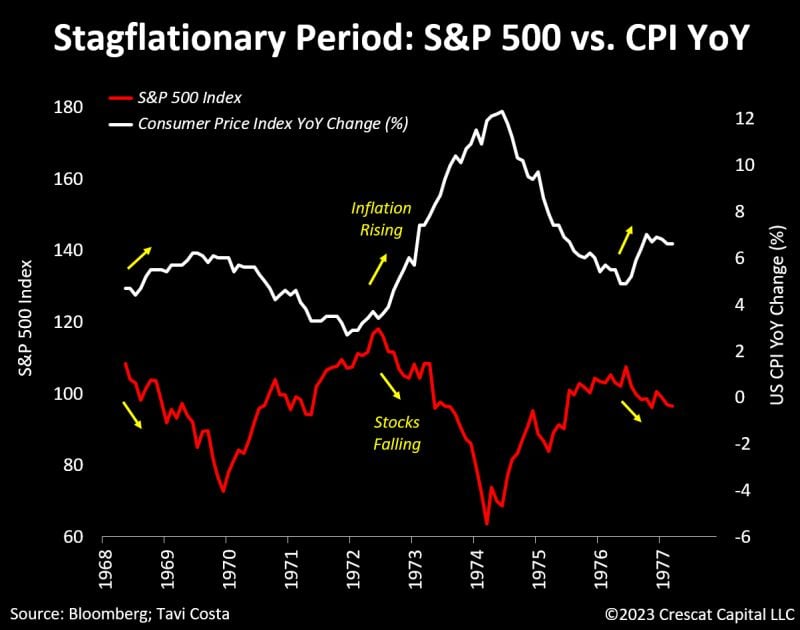
During stagflationary periods, the SP500 index tends to be inversely correlated with inflation
Tavi Costa: "From the late-1960s to the mid-1970s, equity markets declined whenever CPI rates re-accelerated to the upside. The primary driver behind this negative correlation stems from the market's growing concern about the potential for a tighter monetary policy to address the persistent increase in consumer prices". Source: Crescat Capital, Bloomberg
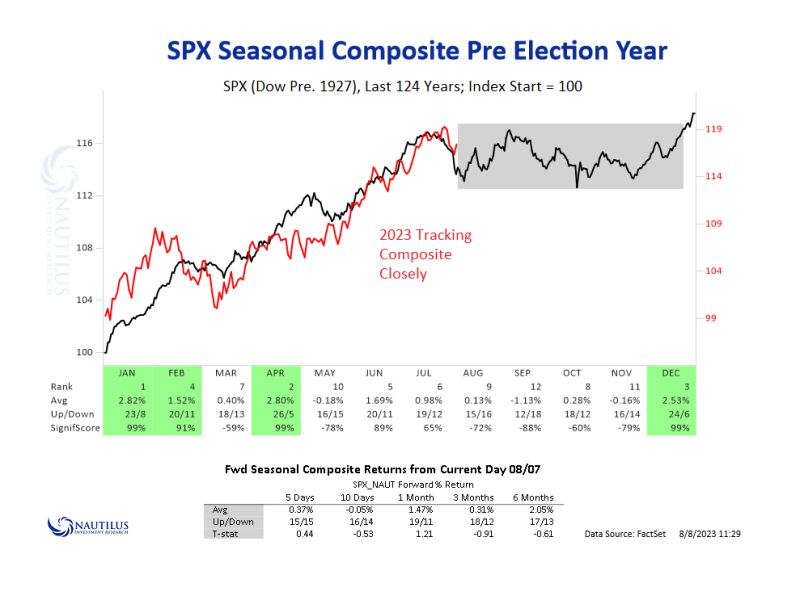
SP500 seasonality and 4-year cycle analysis suggests a consolidation before a year-end rally
Source: Nautilus Research
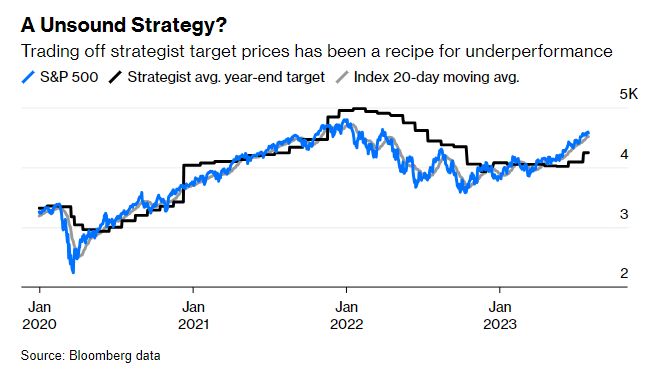
Should you do the opposite of what Wall Street strategists say? Data over the last 3.5 years suggests that strategists underperform the S&P 500
Source: Barchart, Bloomberg
Investing with intelligence
Our latest research, commentary and market outlooks


