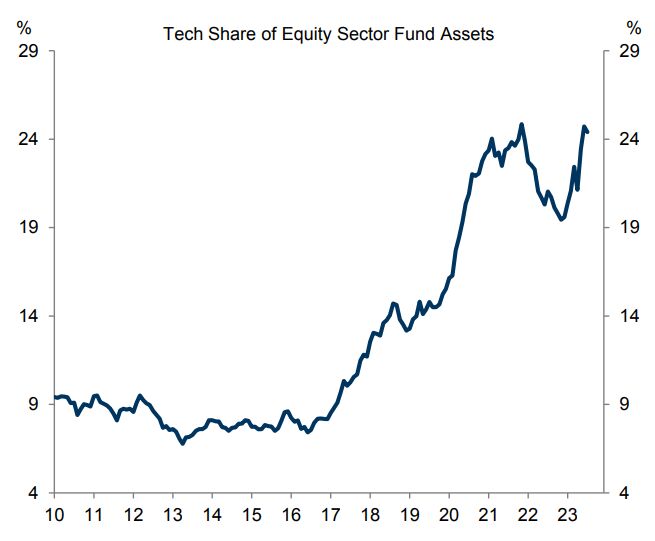
Technology stocks now reflect a record ~25% of all equity fund assets
Just 8 years ago, technology stocks only reflected just ~9% of all equity fund assets. Meanwhile, 5 stocks currently account for ~70% of the Nasdaq's gain this year. Technology stocks have become the backbone of the stock market. Source: The Kobeissi Letter
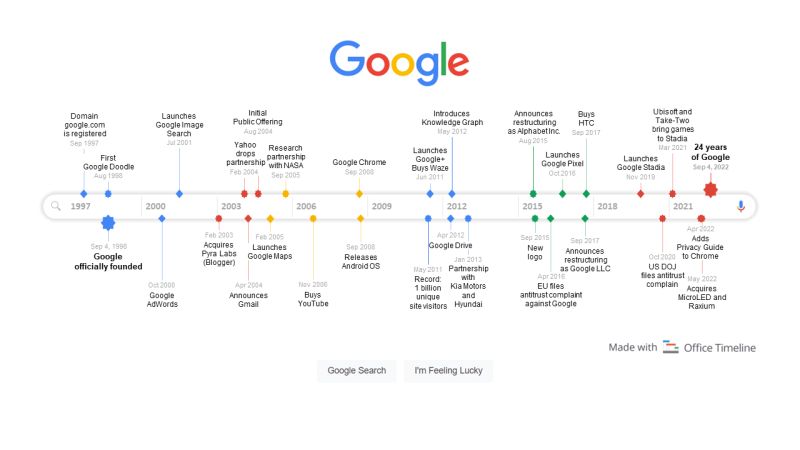
HAPPY BIRTHDAY GOOGLE!
OTD in Tech History 4 September 1998, Google was founded by Larry Page and Sergey Brin, while they were PhD students at Stanford University. Below a Timeline and FAQ about Google (by officetimeline.com): 1) When was Google created? The search engine Google started development in 1996, and it was originally named Backrub, which later became Google, a play on the term “googol”. Google Inc. was officially founded on September 4, 1998 to market Google Search. 2) What does Google mean? The name Google is a creative spelling of googol, the mathematical expression for the number 1 followed by 100 zeros. The term googol was coined back in 1930s, and is attributed to Milton Sirotta, the 9-year-old nephew of American mathematician Edward Kasner. Also, google has become a verb, meaning “to use the Google search engine to search for information about someone or something on the internet”. Today, the meaning of the term google has widened even more and is often used as “to look up information online” using any search engine.
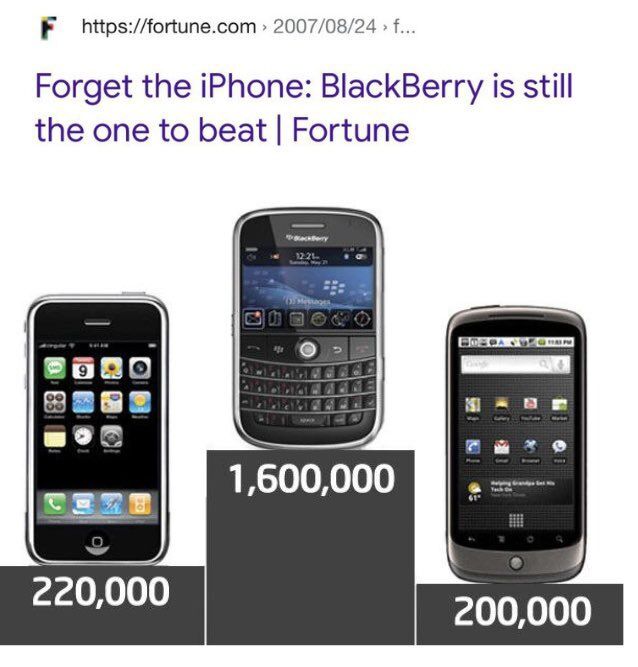
A headline from 2007
Jon Erlichman
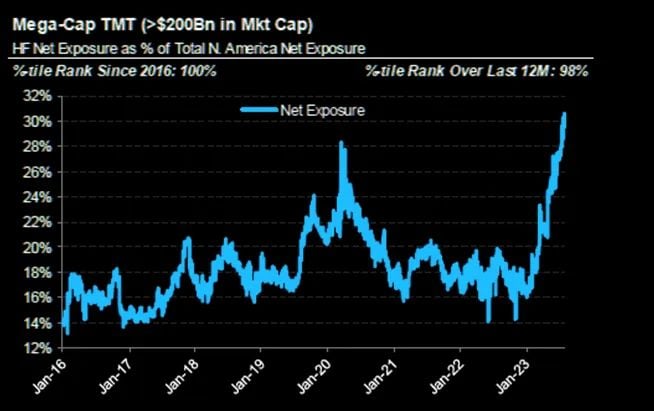
Hedge funds exposure to mega cap tech stocks reaches highest level EVER RECORDED
Source: Barchart, Bloomberg
The last 30 years...
Source: Seek Wiser

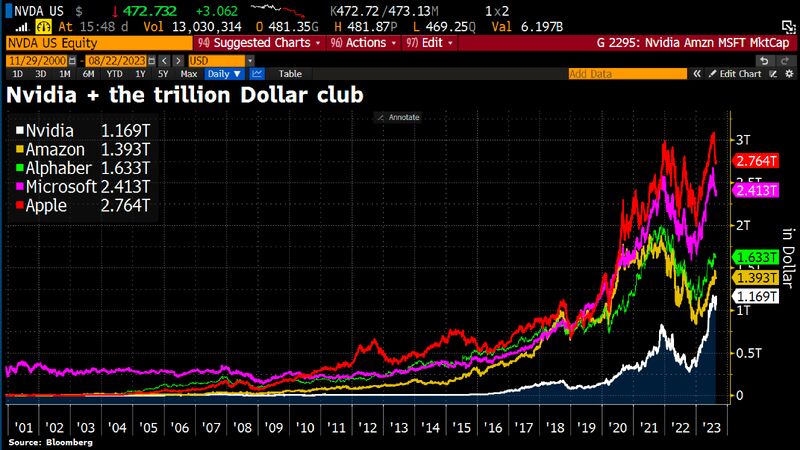
Nvidia establishes itself in the $1 trillion club. But expectations for Wednesday's numbers are immense
In Q1, Nvidia $NVDA crushed analysts’ revenue estimates by 10.4% as revenues rose 19% QoQ to $7.19 billion. The strong sequential growth was led by record data center revenue, primarily helped by accelerated computing as generative AI drove high demand for Nvidia’s products. For Q2, Nvidia is projecting revenues of $11B, up 68% QoQ, with a 400 bp increase in gross margins as AI takes center stage. The AI-hype has driven some stocks valuations to extreme levels. Nvidia is the most emblematic one among large-caps is with a P/E ratio which went from under 50x to 224x in just 8 months. Source: Bloomberg
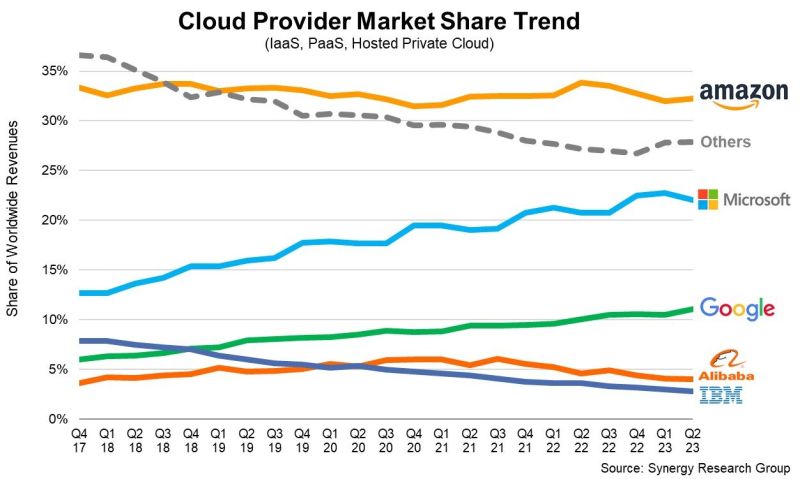
Cloud Infrastructure Services Market
$65 billion in spending in Q2 2023. → +18% Y/Y and +3% Q/Q. Market share: 🟧 $AMZN AWS 32%. 🟦 $MSFT Azure 22%. 🟩 $GOOG GCP 11%. Big 3 = 65% of the market. Estimates by Synergy Research Group. Source: App Economy Insight
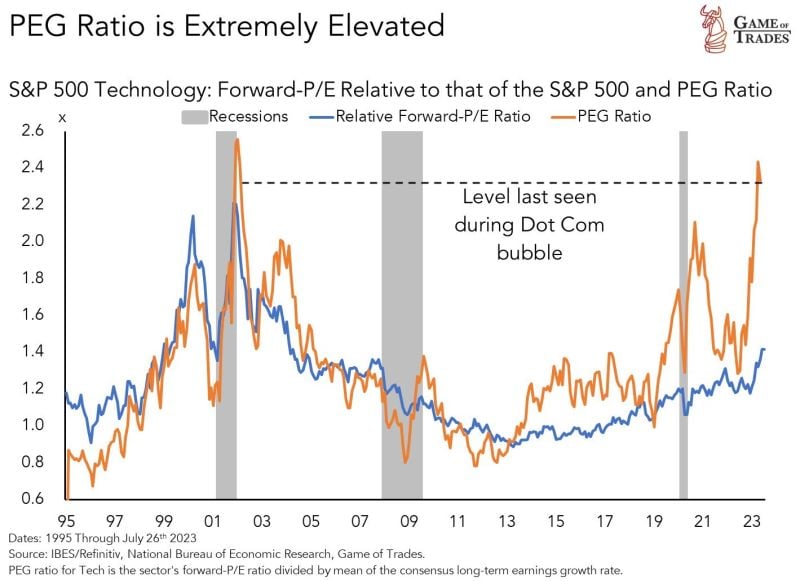
The S&P 500 Technology sector forward P/E to that of the SP500 is not as expensive as it was during the Internet bubble
However, the PEG ratio (forward PE divided by consensus long-term EPS growth rate) is roughly at the same level. Source: Game of Trades