Straight from the Desk
Syz the moment
Live feeds, charts, breaking stories, all day long.
- All
- us
- equities
- Food for Thoughts
- macro
- sp500
- Bonds
- Asia
- bitcoin
- Central banks
- markets
- technical analysis
- investing
- inflation
- europe
- Crypto
- interest-rates
- Commodities
- geopolitics
- performance
- gold
- ETF
- nvidia
- tech
- AI
- earnings
- Forex
- Real Estate
- oil
- bank
- FederalReserve
- Volatility
- apple
- nasdaq
- emerging-markets
- magnificent-7
- energy
- Alternatives
- switzerland
- trading
- tesla
- sentiment
- Money Market
- russia
- France
- UK
- assetmanagement
- ESG
- Middle East
- china
- amazon
- ethereum
- microsoft
- meta
- bankruptcy
- Industrial-production
- Turkey
- Healthcare
- Global Markets Outlook
- recession
- africa
- brics
- Market Outlook
- Yields
- Focus
- shipping
- wages
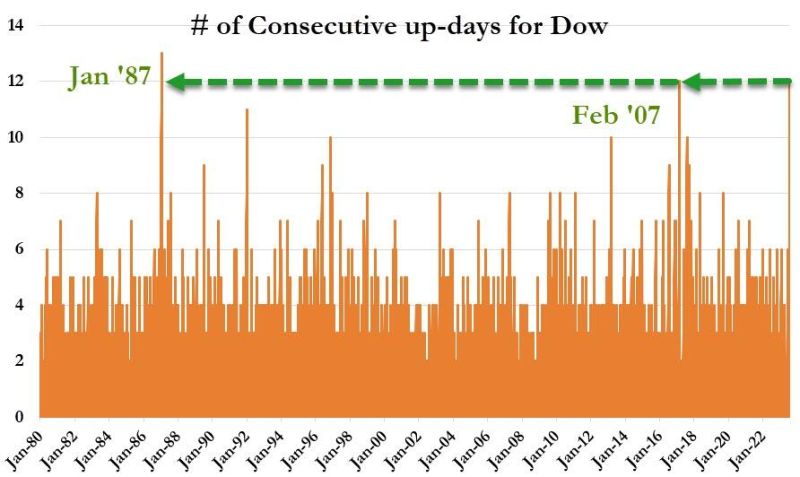
The last time The Dow had a longer winning streak than this (12 straight days) was in Jan 1987 (13 days - the all-time record win streak)...
Source: Bloomberg, www.zerohedge.com
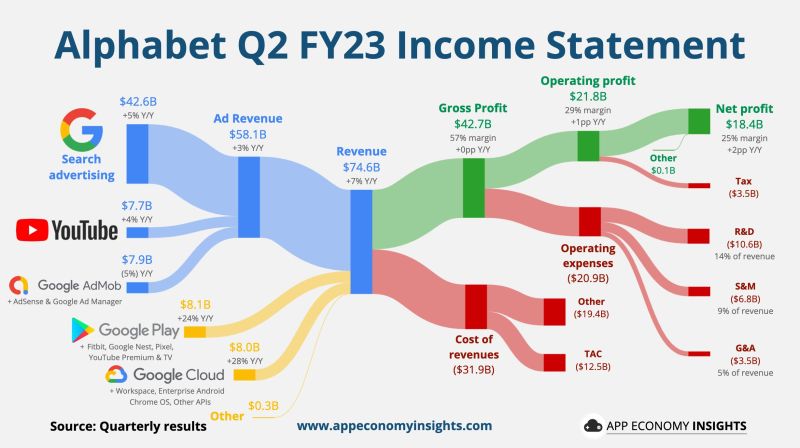
Alphabet shares rose about 7% in extended trading on Tuesday after the company reported better-than-expected revenue and profit, driven by growth in its cloud-computing unit.
For the fourth straight quarter, Google’s parent company reported growth in the single digits as it reckons with a pullback in digital ad spending that reflects concerns about the economy. Analysts don’t expect growth to hit double digits again until the fourth quarter. $GOOG Alphabet Q2 FY23 details by App Economy Insights • Revenue +7% Y/Y to $74.6B ($1.8B beat) • Operating margin 29% (+1pp Y/Y) • EPS $1.44 ($0.10 beat) ☁️ Google Cloud: • Revenue +28% Y/Y to $8.0B. • Operating margin 5% (+14pp Y/Y). ▶️ YouTube ads +4% to $7.7B. Source: App Economy Insights, CNBC
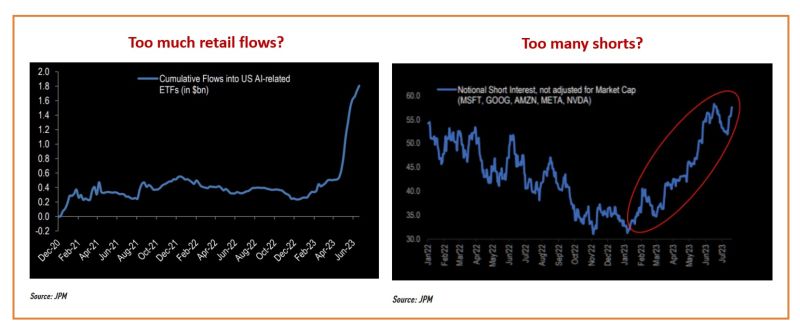
When it comes to the rush into AI stocks, these 2 charts are not easy to interpret from a contrarian perspective
On one hand, record inflows into AI etfs could mean there is too much "hot money" = BEARISH from a contrarian perspective. On the other hand, shorts continue to accumulate positions betting on a collapse of AI-related mega-caps tech stocks. This is BULLISH from a contrarian perspective. Source chart: JPM, TME
US credit delinquencies including housing have now risen above 2009 levels.
Source: Sven Henrich
Something very unusual has been taking place since the start of the 2Q earnings season
US stocks that beat earnings are being sold... very unusual. Source: www.zerohedge.com
The median price of an existing home sold in the US is up 14% from the January low, now less than 1% below its all-time high from June 2022.
How could it be? Consider the #chart below courtesy of Charlie Bilello: The US Population is 19% higher than where it was in January 2000 while the inventory of Existing Homes for sale in the US is 37% lower. Economics 101 -> higher demand and lower supply drive prices higher.
Investing with intelligence
Our latest research, commentary and market outlooks


