Straight from the Desk
Syz the moment
Live feeds, charts, breaking stories, all day long.
- All
- us
- equities
- Food for Thoughts
- macro
- sp500
- Bonds
- Asia
- bitcoin
- Central banks
- markets
- technical analysis
- investing
- inflation
- europe
- Crypto
- interest-rates
- Commodities
- geopolitics
- performance
- gold
- ETF
- nvidia
- tech
- AI
- earnings
- Forex
- Real Estate
- oil
- bank
- FederalReserve
- Volatility
- apple
- nasdaq
- emerging-markets
- magnificent-7
- energy
- Alternatives
- switzerland
- trading
- tesla
- sentiment
- Money Market
- russia
- France
- UK
- assetmanagement
- ESG
- Middle East
- china
- amazon
- ethereum
- microsoft
- meta
- bankruptcy
- Industrial-production
- Turkey
- Healthcare
- Global Markets Outlook
- recession
- africa
- brics
- Market Outlook
- Yields
- Focus
- shipping
- wages
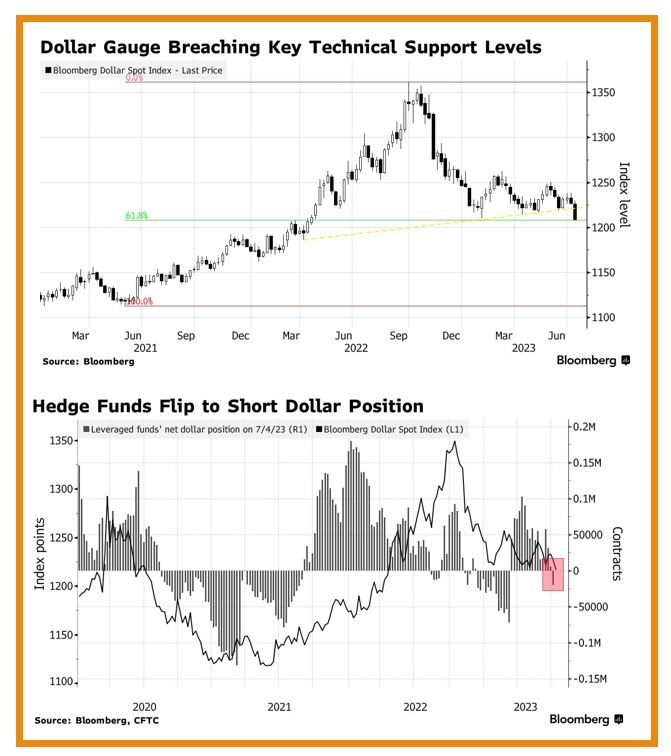
The Bloomberg Dollar Spot Index slumped to a 15-month low, with the gauge now down over 11% from a September peak
The Bloomberg Dollar Spot Index slumped to a 15-month low, with the gauge now down over 11% from a September peak. hedgefunds had been bracing for weakness, as they turned net sellers of the dollar for the first time since March, according to data from the Commodity Futures Trading Commission aggregated by Bloomberg. The dollar’s resilience has confounded bears who had warned that the currency was headed for a multi-year decline following a surge in 2022. But there’s a growing conviction that they may finally be proven right as easing inflation backs the case for the us central bank to wrap up its rate-hike campaign in the coming months. Source: Bloomberg
US inflation eased further in June w/core & headline coming in each at 0.2% MoM (v.s 0.3% expected).
Headline CPI slowed to 3% YoY vs 3.1% expected (and lowest since March 2021), core dropped to 4.8% YoY vs 5% expected. This is the 12th straight month of YoY declines in headline CPI - equaling the longest streak of declines in history (since 1921)... Source chart: Bloomberg
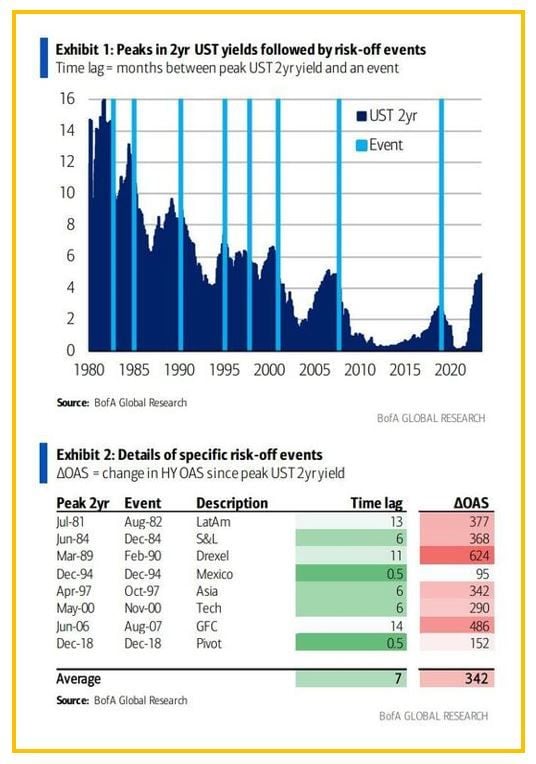
These charts by Bank of America show that every single episode of a local peak in UST 2yr yield was followed by some risk-negative event over the past 40 years.
These #charts by Bank of America show that every single episode of a local peak in UST 2yr yield was followed by some risk-negative event over the past 40 years. Such episodes ranged from mild (Mexican peso crisis in Dec 1995; HY +95bp) to moderate (Asia FX crisis in Oct 1997; HY +350bp ) to severe (GFC; HY all-time wides). The lag between the peak in 2yr yield and subsequent event varies from just a couple of weeks to just over a year, with an average being 7 months. Source: BofA, www.zerohedge.com
Investing with intelligence
Our latest research, commentary and market outlooks


