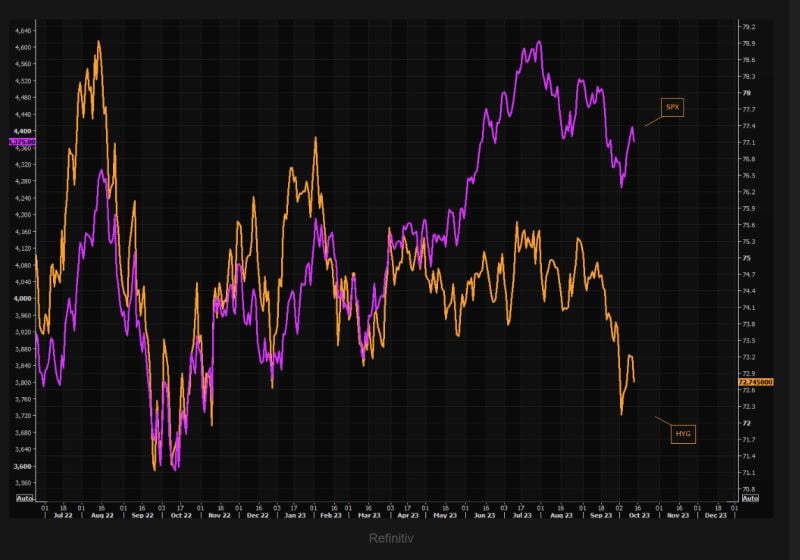
The gap between HYG (US High Yield) and the SPX (S&P 500) is getting wider and wider...
Source: TME
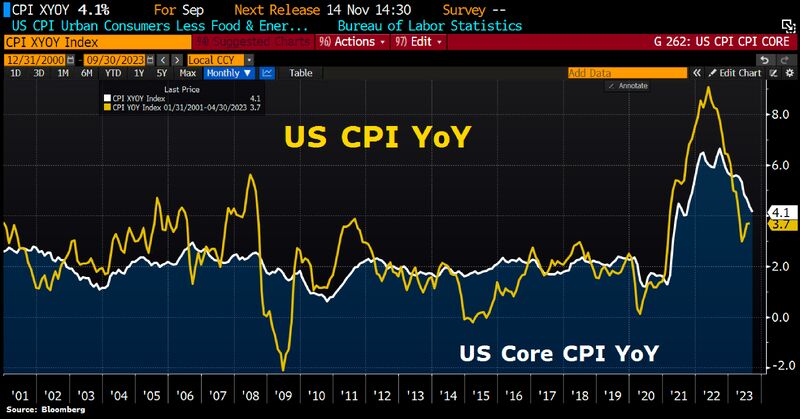
US inflation is cooling, but only slowly
From the perspective of the Fed, the figures are probably not worrying enough to trigger another interest rate hike. However, they are not good enough to sound the all-clear either, CBK says. Source: HolgerZ, Bloomberg
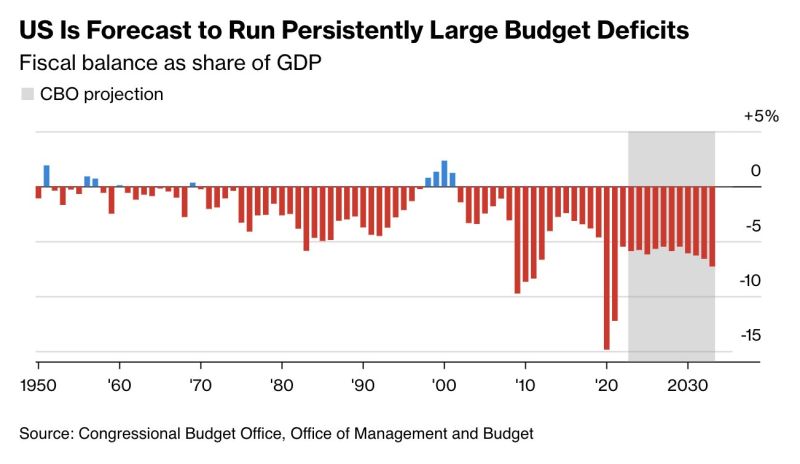
The United States is on an unsustainable fiscal path warns the IMF which projects the U.S. deficit to be 'elevated and persistent
Source: barchart, CBO
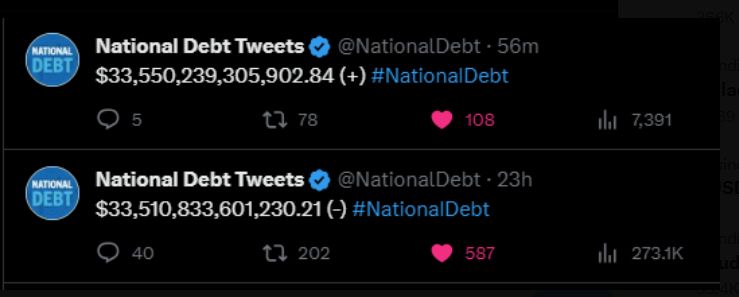
Another $40 billion in US debt today
US national debt has jumped by $550 billion in the past 3 weeks. This is WAY above the pace of $2 trillion per year expected by the government. The US was at $31.4 trillion just 4 months ago. Debt has increased by $2.1 trillion in the past 4 months. Source: WallStreetSilver
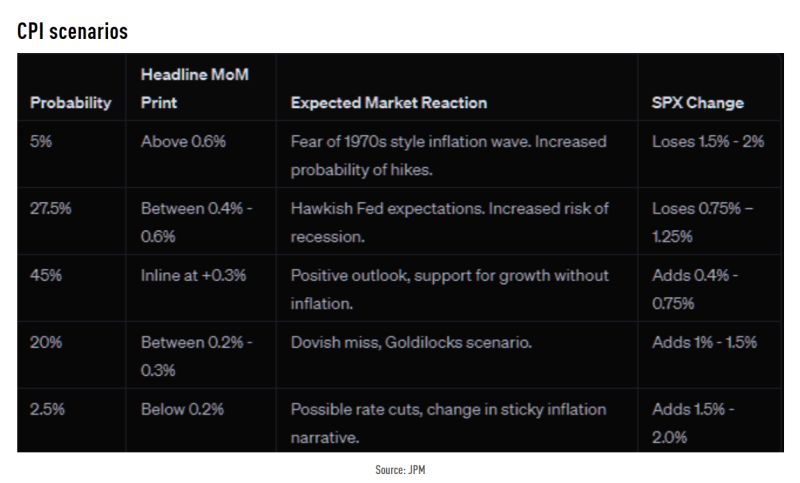
What to expect from today's US CPI data? Main take via JPM's market intelligence team
Source: JPM, TME
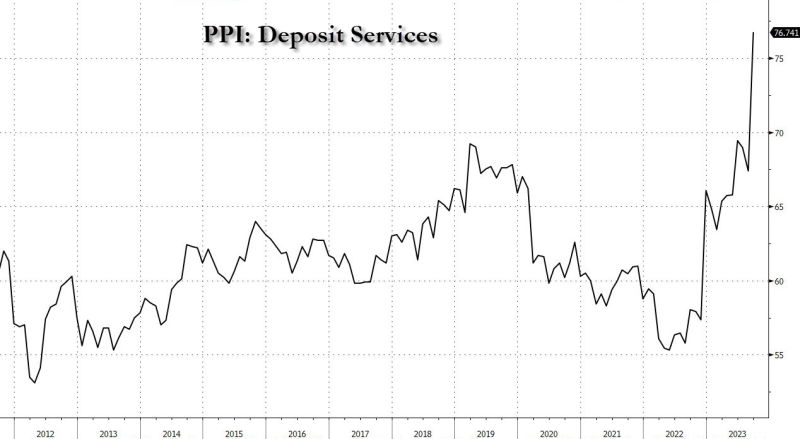
Prices paid to US producers rose by more than forecast in September
The PPI for final demand advanced 0.5% from a month earlier, according to the Bureau of Labor Statistics. The cost of gasoline increased 5.4% The biggest driver of today's PPI beat: a near record surge in PPI Deposit Services. In other words high rates (and inflation) lead to higher rates (and inflation) Source: www.zerohedge.com
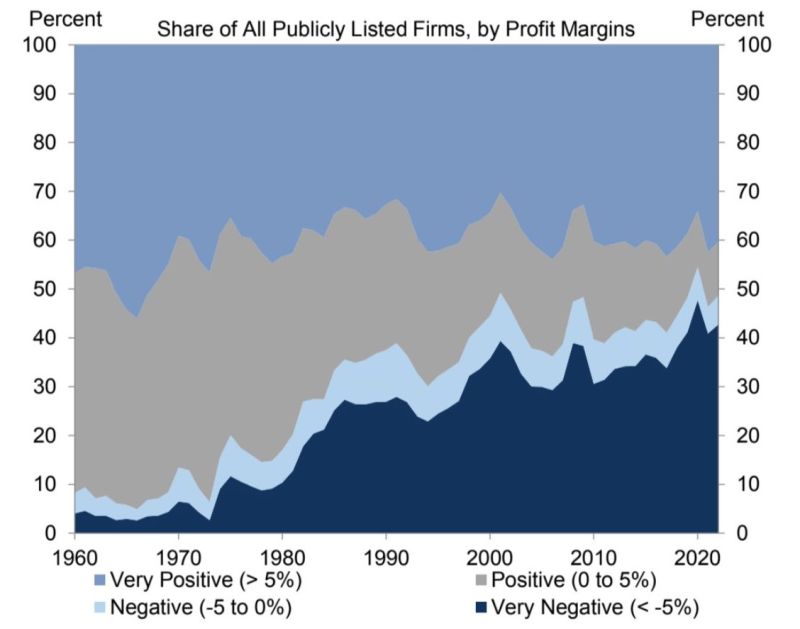
Almost half of US listed firms have negative profit margins
They have been able to survive in artificially low interest rates and ample liquidity environment. Things have changed though. Source: GS, Michel A.Arouet
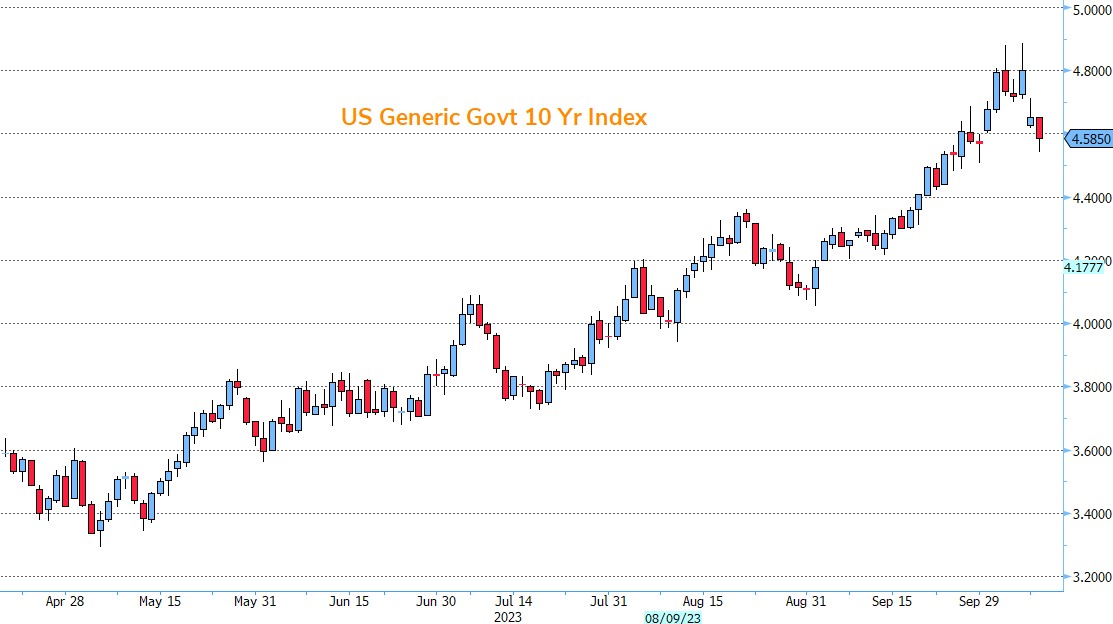
US 10-year Yield pullback from last week peak
US 10-year Yield pullback sharply from last week peak. After the Non-Farm Payrolls report on Friday, the US 10-year Govt Yield came close to hitting 4.9%. As of today, that Yield is down below 4.6%.