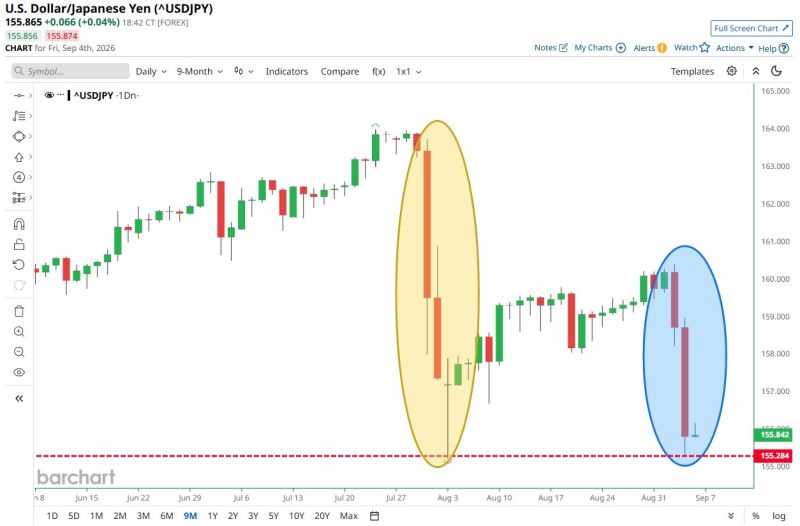
Someone trying to save the Japanese Yen again
Source: Barchart
Breaking: Blackstone just restricted withdrawals from its $77 billion private credit fund for the second consecutive quarter
They have only returned 50% of investors request Companies capping withdrawals: • Blackstone • Blue Owl Capital • Apollo Management • Ares Management • BlackRock • Starwood Capital Source: Michael Burry Stock Tracker

The French 10-year bond yield reached 4.27% yesterday (Thursday)
If this continues, the ECB will print many new colorful euros. The first euro crisis triggered by Greece was about hundreds of billions. France is about trillions (3.53 trillions euros to be precise). Source: Michel A.Arouet

With just 60 days until the US midterms, the pressure on the White House is intensifying.
Diesel at $240 a barrel. Gasoline at $4.10 a gallon. The US 10-year yield at 4.75%. As the economic pain mounts, the President will face growing pressure to do—or say—whatever it takes to bring oil prices down. Source: Brad Moseley

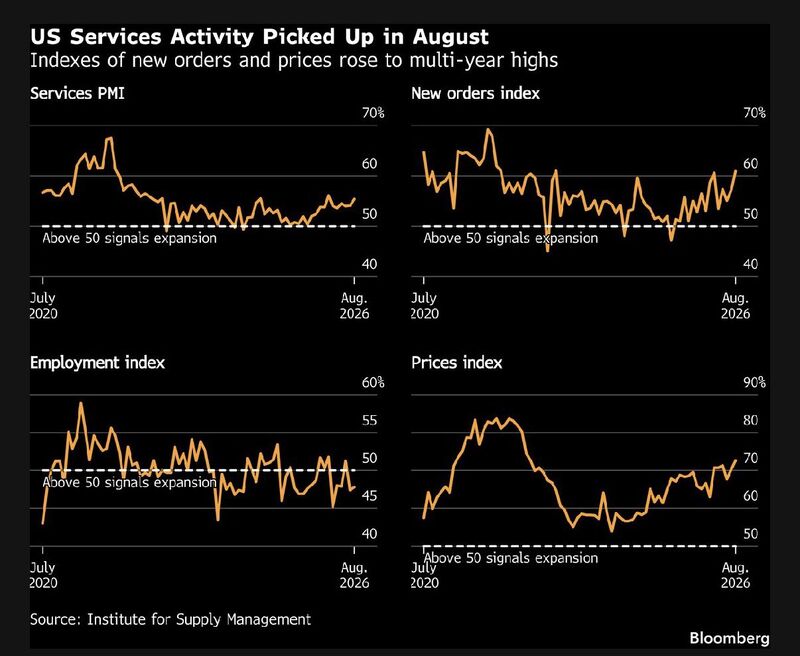
The US ISM Services report was particularly strong, both overall and relative to expectations
With nearly all activity and price subcomponents rising robustly (employment being the lone exception). Notably, overall business activity expanded to a six-month high, new orders climbed to their highest level in over three years, and prices paid reached a four-year peak. Source: Bloomberg, Mo El Erian
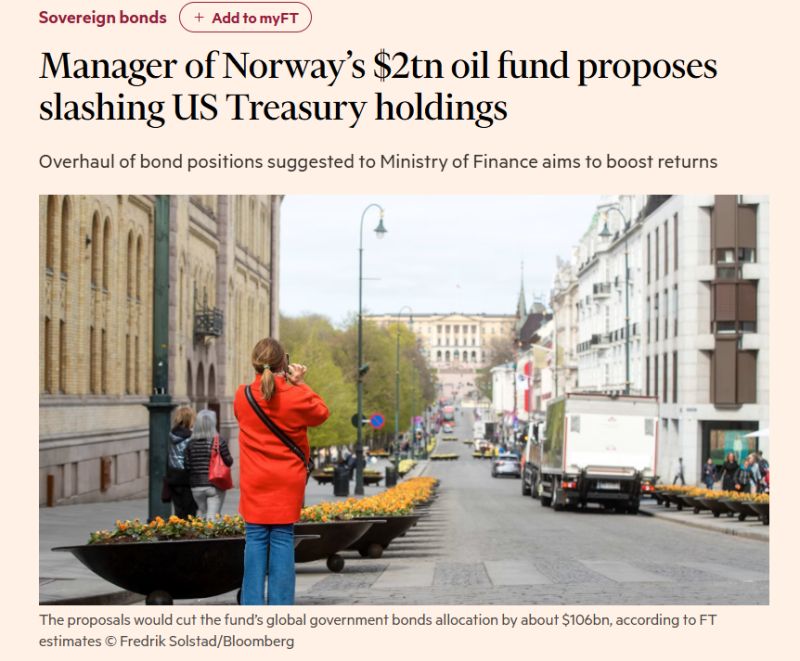
Norway’s $2.3 trillion sovereign wealth fund could be preparing a major shift away from US Treasuries.
Norges Bank Investment Management has proposed cutting government bonds from 70% to 50% of its fixed-income benchmark. The potential impact: • Around $106 billion less in global government debt • An estimated $80 billion reduction in US Treasuries • More capital redirected toward higher-returning areas of the bond market The fund currently invests just under 26% of its assets in fixed income. The timing is significant. Government debt is surging. Inflation risks are returning. And despite repeated US Treasury interventions, long-term yields remain near multiyear highs. This does not mean Norway is abandoning Treasuries. But when one of the world’s largest investors questions the traditional government-bond allocation, markets should pay attention. The message is clear: sovereign debt may no longer offer the risk-return profile it once did. Source: Financial Times
Nobody saw this one coming.
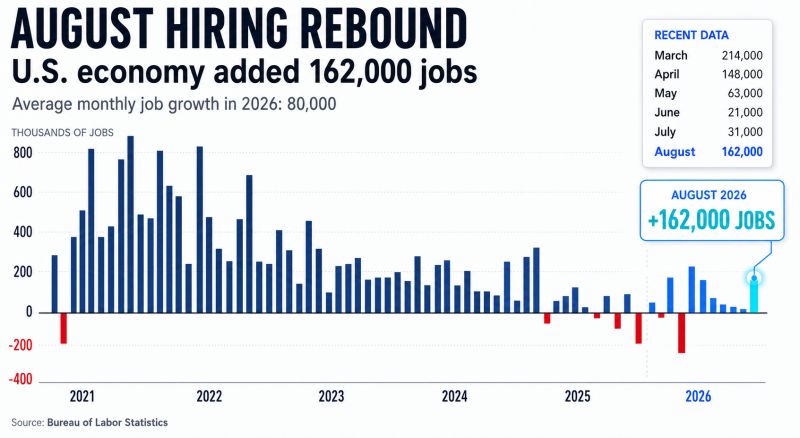
Wall Street expected just 55,000 new jobs in August, but the US economy added 162,000, nearly three times consensus, while July and June were also revised higher by a combined 55,000. Unemployment remained at 4.1% and the participation rate rose to 61.6%, with job creation broadening beyond healthcare to hospitality, education, construction and manufacturing. With the 2026 monthly average now around 80,000 jobs versus only 10,000 in 2025, the report suggests a much more resilient labour market than recent weakness narratives implied. For markets, however, stronger employment could weaken the case for Fed rate cuts, potentially putting upward pressure on yields and the dollar while weighing on stocks, crypto and gold. Source: BLS
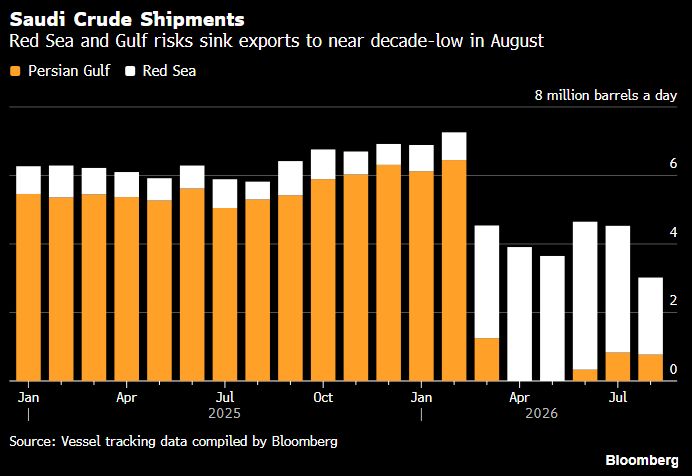
Saudi Crude Shipments
"Saudi Arabia’s observed crude exports last month slumped to the lowest in at least nine years" "The kingdom’s oil exports were about 3 million barrels a day in August" "Saudi ships have come under attack in the Red Sea from Yemen’s Houthi militants". Source: Bloomberg Ziad Daoud