Straight from the Desk
Syz the moment
Live feeds, charts, breaking stories, all day long.
- All
- equities
- United States
- Macroeconomics
- Food for Thoughts
- markets
- Central banks
- Fixed Income
- bitcoin
- Asia
- europe
- investing
- geopolitics
- gold
- technical analysis
- Commodities
- Crypto
- AI
- Technology
- nvidia
- ETF
- earnings
- Forex
- china
- Real Estate
- oil
- banking
- Volatility
- energy
- magnificent-7
- apple
- Alternatives
- emerging-markets
- switzerland
- tesla
- United Kingdom
- Middle East
- assetmanagement
- amazon
- microsoft
- russia
- ethereum
- ESG
- meta
- Industrial-production
- bankruptcy
- Healthcare
- Turkey
- Global Markets Outlook
- africa
- Market Outlook
- brics
- performance
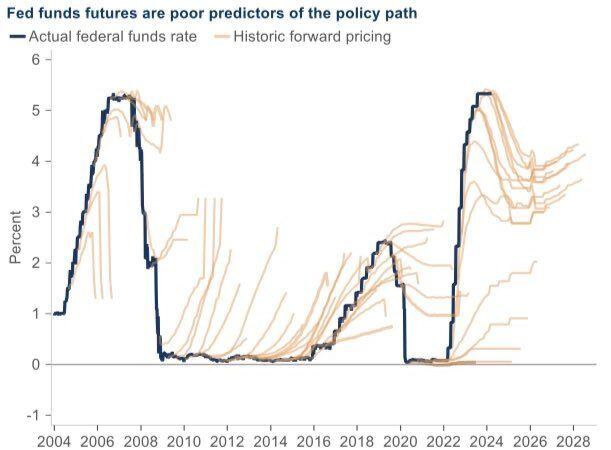
Friendly reminder that markets are always wrong about future Fed funds rate.
Source: Michel A.Arouet
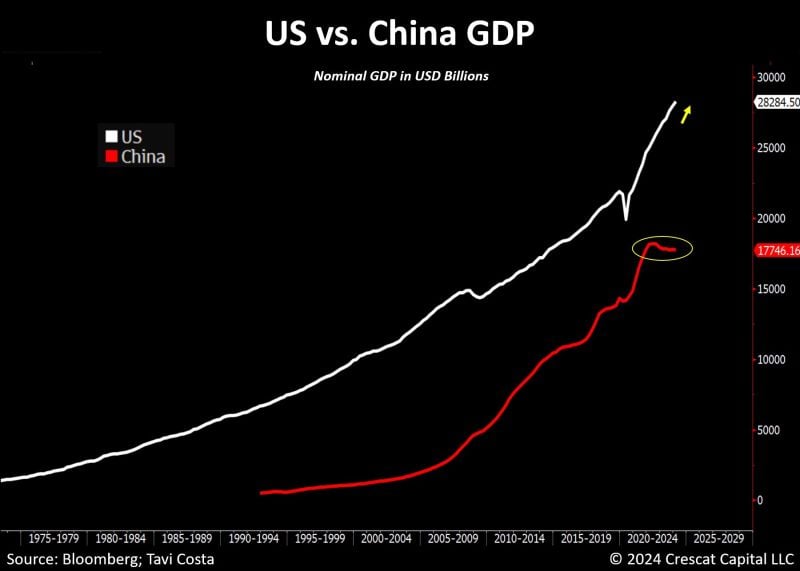
As highlighted by Tavi Costa, this is one of the reasons China is enhancing teh quality of its international reserves and accumulating gold:
China’s macro imbalances are increasing pressure on its monetary system to devalue. Source: Bloomberg, Tavi Costa, Crescat Capital
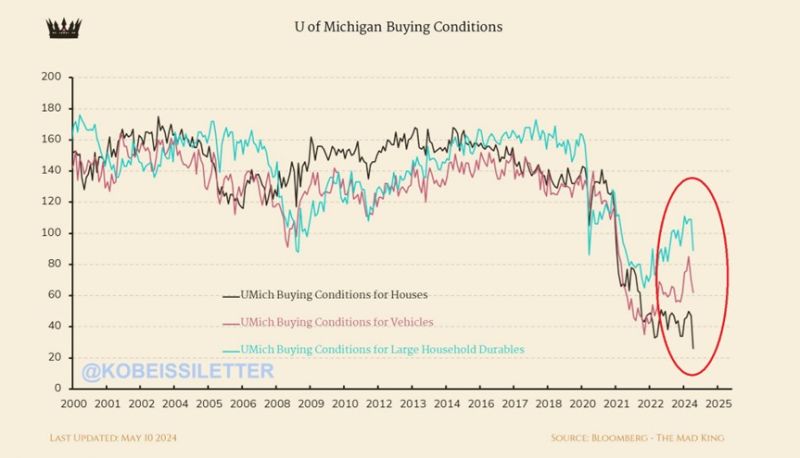
Homebuyer conditions for US consumers plummeted to their lowest level in history this month.
The index of buying conditions for houses fell to ~30 points which is below the previous low of ~40 points in the early 1980s. In just 4 years, conditions for buying a house have dropped by 110 points, a massive 73% decline. Meanwhile, buying conditions for vehicles and large household durables are down for 3 straight months. Source: The Kobeissi Letter
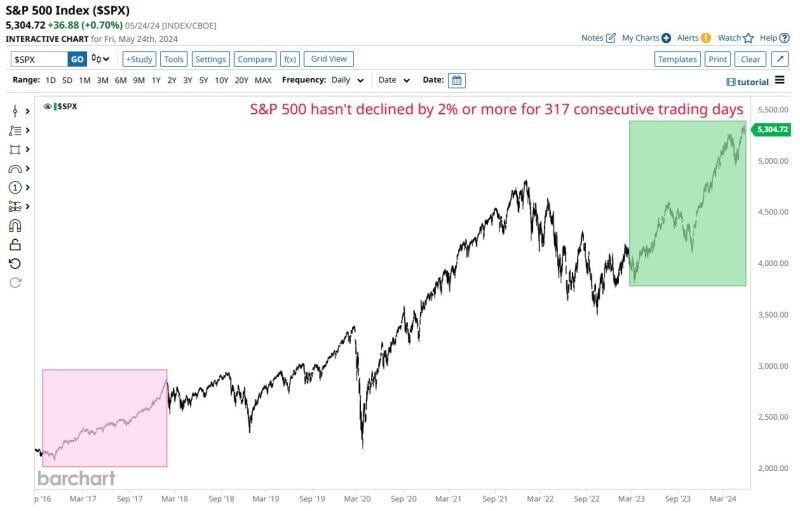
S&P 500 $SPX hasn't declined by 2% or more for 317 consecutive trading days, the longest streak since a 351-day stretch that lasted from Sep 2016 through Feb 2018.
Source: Barchart
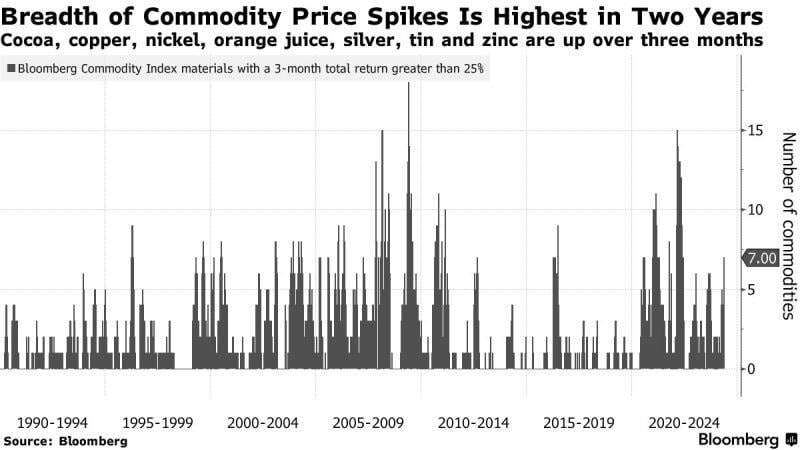
The breadth in commodity price spikes is the highest in two years
Source: Bloomberg
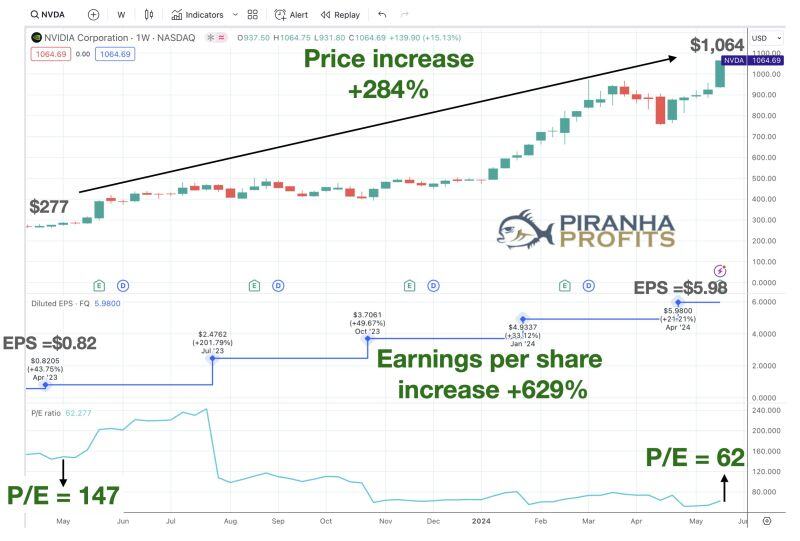
The higher a stock's price goes, the more expensive it gets. Right? Well, not always.
A year ago, when NVDA was selling at $277, its earnings per share was $0.82 and its P/E ratio was 147x Today, NVDA's share price is up +284% to $1,064.... BUT... Its earnings per share is up +629% to $5.98. Its P/E has fallen to 62x... forward P/E is now at 30x So, NVDA is CHEAPER today than it was a year ago. Source: Adam Khoo Trader, Piranha Profits
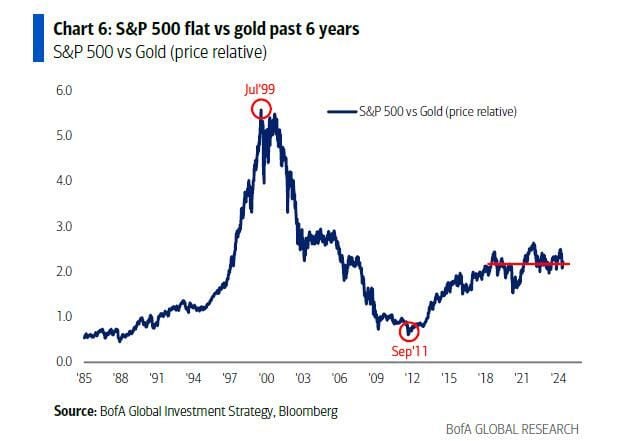
Did you know that the S&P 500 has been basically flat vs gold over the last six years? 🤔
Source: Markets & Mayhem, BofA
Investing with intelligence
Our latest research, commentary and market outlooks


