

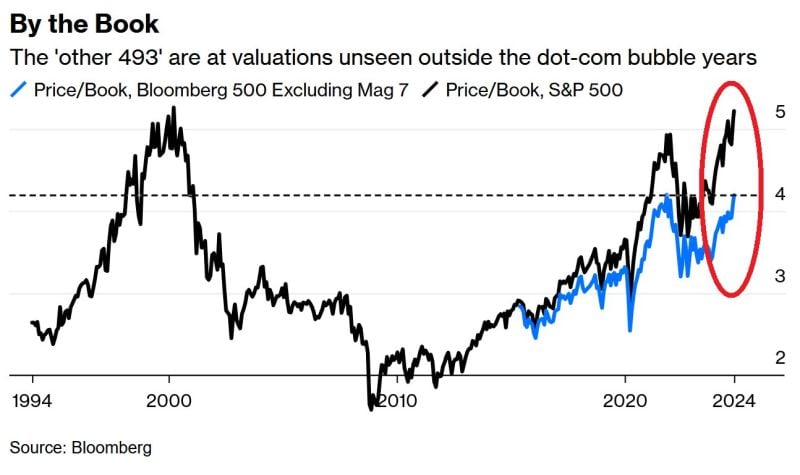
S&P 500 VALUATION IS IN LINE WITH THE 2000 DOT-COM BUBBLE PEAK
S&P 500 Price to Book (assets minus liabilities) ratio is now 5.2x, the most on record and in line with the 2000 Dot-Com bubble burst. When excluding the Magnificent 7 group, the P/B ratio is 4.2x, near a record. Source: Global Markets Investor
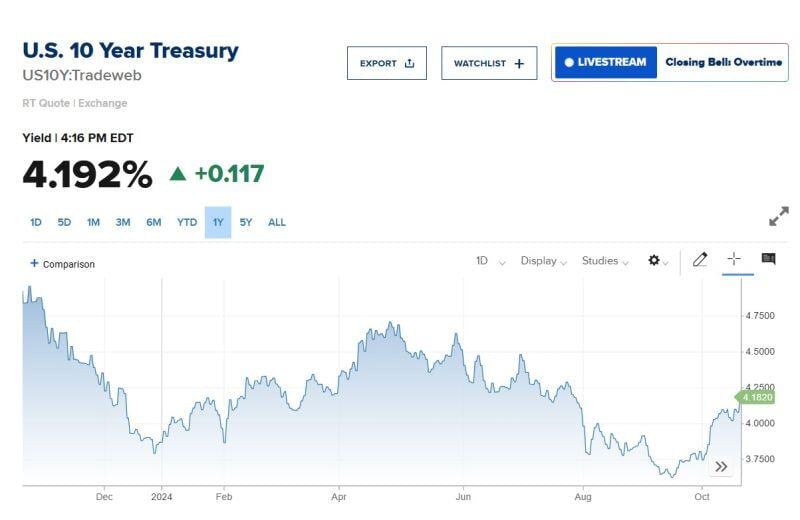
The 10 year bond yield soared on Monday, closing i on 4.2%.
The rise in bond yields took stocks down with them. Has the Fed lost control of the bond market? Was the Fed jumbo rate cut a policy mistake?
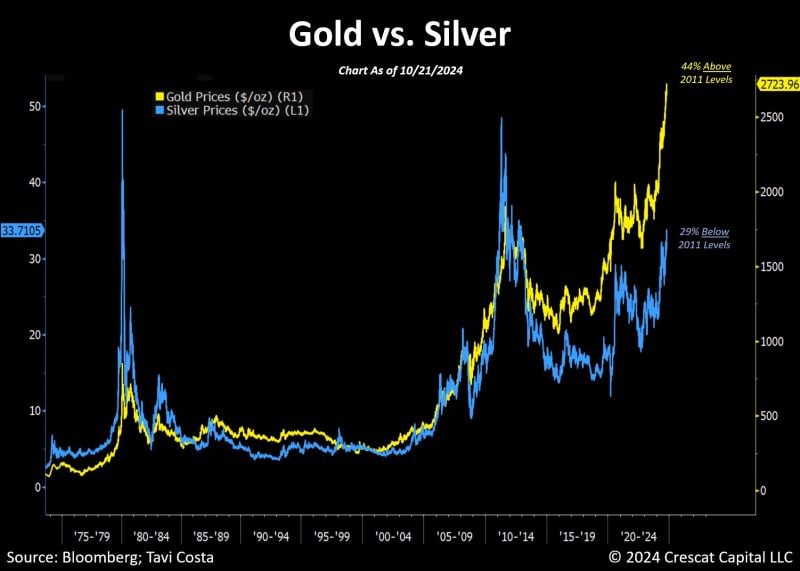
Gold is now 44% above its 2011 peak, while silver remains nearly 30% below its level from the same period.
Source: Crescat Capital, Blomberg, Tavi Costa
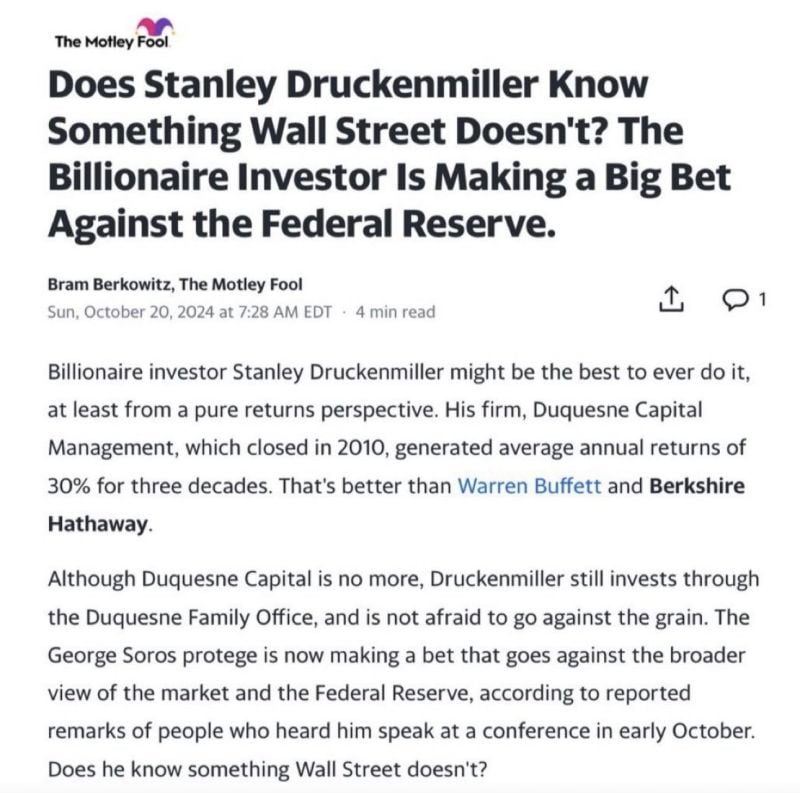
Druckenmiller is shorting U.S. Treasuries with a record setting 20% of his portfolio.
He knows what's about to happen ("Interest rates could double from here.") Source: Financelot @FinanceLancelot on X
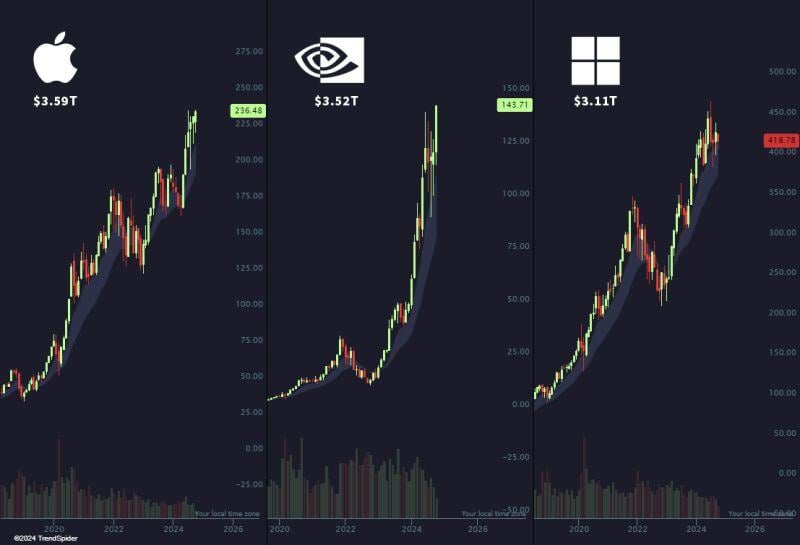
The race to $4 trillion market-cap is ON. 🏁
Which company do you think will be the first to hit this historic milestone? $AAPL $NVDA $MSFT Source: Trend Spider
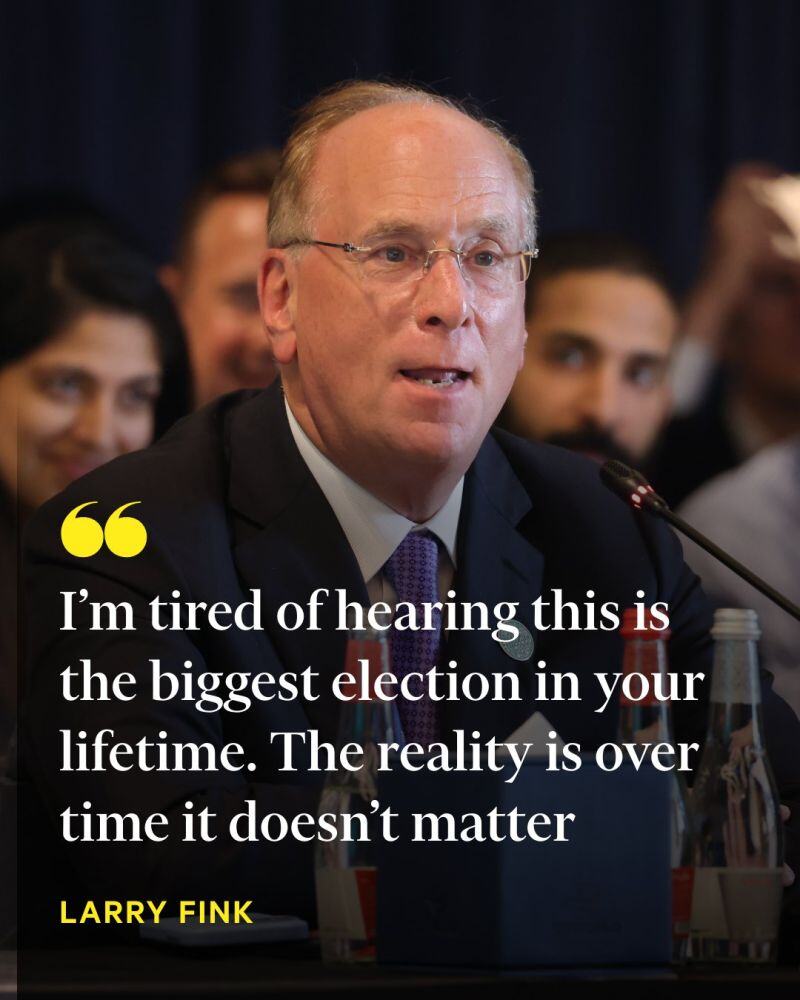
The co-founder of the world’s largest asset manager has said the outcome of the looming US election between Kamala Harris and Donald Trump 'really doesn’t matter' for financial markets.
https://lnkd.in/eZCKpyDZ Source: FT
Tuesday humour
Source: Wall Street Silver
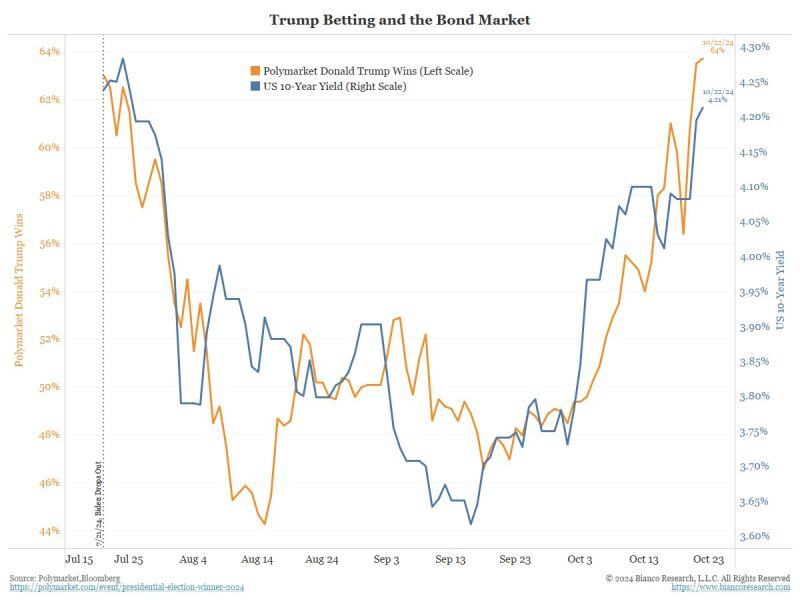
A fascinating chart by James Bianco ->
The 10-year yield (blue) and Trump's Political Betting probabilities (orange). The chart starts the day Biden dropped out. Coincidence, or are these series related? If they are related, what happens to 10-year yields if the orange line (man) goes to 100 in 14 days? Source: Bianco Research