Straight from the Desk
Syz the moment
Live feeds, charts, breaking stories, all day long.
- All
- equities
- United States
- Macroeconomics
- Food for Thoughts
- markets
- Central banks
- Fixed Income
- bitcoin
- Asia
- europe
- investing
- geopolitics
- gold
- technical analysis
- Commodities
- Crypto
- AI
- Technology
- nvidia
- ETF
- earnings
- Forex
- china
- Real Estate
- oil
- banking
- Volatility
- energy
- magnificent-7
- apple
- Alternatives
- emerging-markets
- switzerland
- tesla
- United Kingdom
- Middle East
- assetmanagement
- amazon
- microsoft
- russia
- ethereum
- ESG
- meta
- Industrial-production
- bankruptcy
- Healthcare
- Turkey
- Global Markets Outlook
- africa
- Market Outlook
- brics
- performance
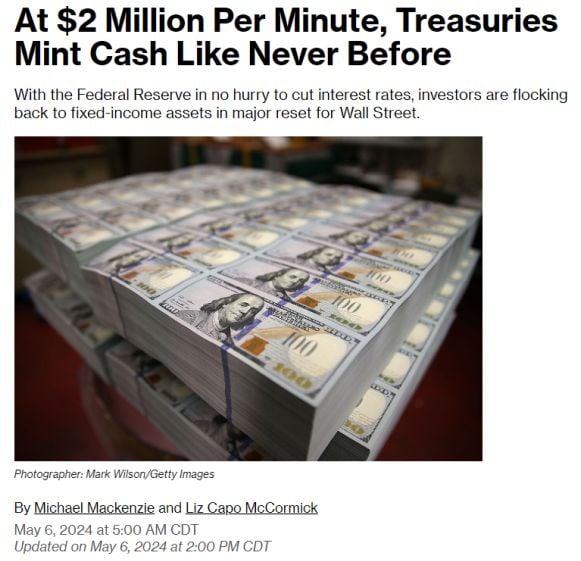
BREAKING 🚨: U.S. Treasury
U.S. Treasuries are now paying out $2 million per minute! Source: Barchart
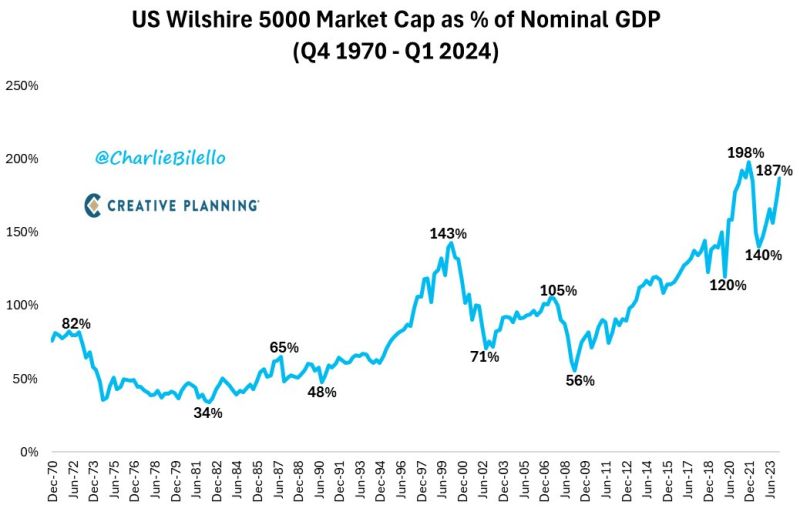
US Stock Market Capitalization as % of GDP...
1984: 42% 1994: 63% 2004: 93% 2014: 114% 2024: 187% Source: Charlie Bilello
“If you cannot control your emotions, you cannot control your money.”
— Warren Buffett Andrew Lokenauth | TheFinanceNewsletter.com
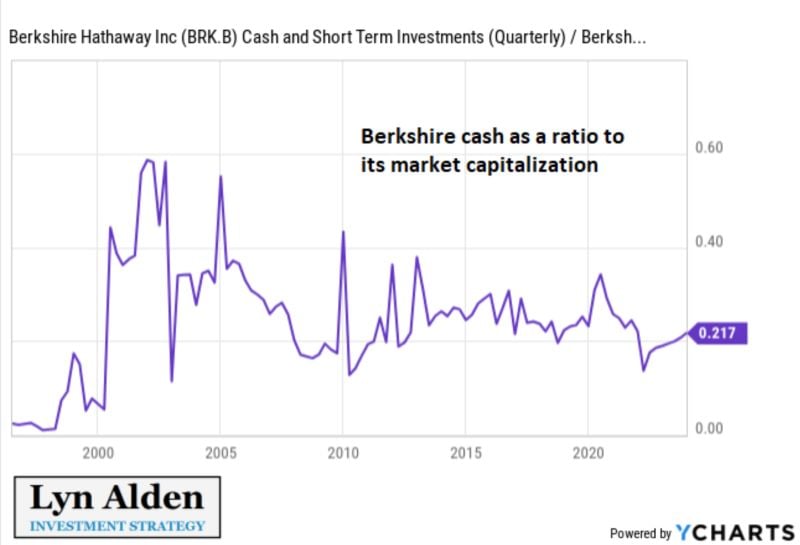
As highlighted by Lyn Alden ->
"People often report the nominal amount of cash that Berkshire $BRK.B has, as though Buffett is hoarding cash. You can't just look at the nominal cash level. All of Berkshire's numbers go up. An insurer needs a lot of liquidity. His cash as a % of his assets is in a normal range".
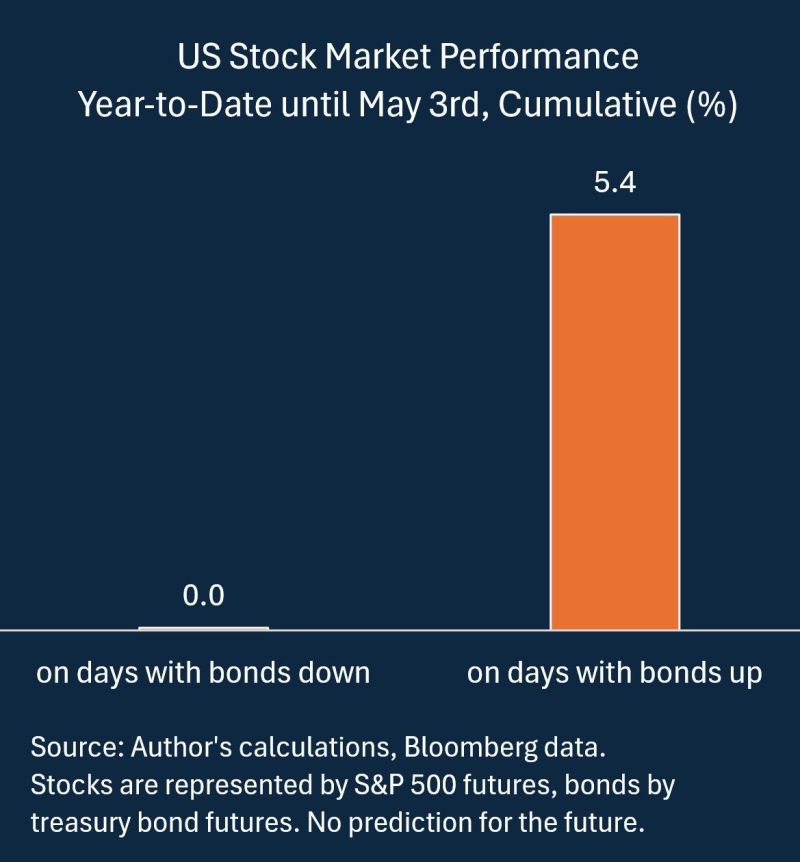
Great observation by Dr. Michael Stamos, CFA - Head of Global Research & Development of Global Multi Asset Department at Allianz Global Investors
-> "On days when bonds were up, stocks tended to go up as well. When bonds fell, stocks managed to stay at least flat. Overall it was a pretty nice environment for equity investors. Lets hope this doesn't turn into a high-correlation-when-markets-are-down type of environment".
Investing with intelligence
Our latest research, commentary and market outlooks


