Lyn Alden's 'ORANGE JUICE' Raises $40 million to launch a permanent capital holding company backed by a BTC treasury
"It’s a company that acquires, improves, and permanently holds cash-flowing businesses, backed by a bitcoin treasury" - Lyn Alden Source: Bitcoin Magazine

THIS WEEK COULD RESHAPE THE FUTURE OF CRYPTO.
Two major structural catalysts are approaching. • Monday: The Senate returns, and the CLARITY Act enters its final push before the August recess. If passed, it would split crypto oversight between the CFTC and SEC, protect DeFi developers, and permanently ban a federal CBDC. • Wednesday: DTCC targets its first limited production tokenization trades. The firm behind $114T+ in cleared assets is bringing stocks, ETFs, and Treasuries on-chain with backing from BlackRock, Goldman Sachs, JPMorgan, and Citi. Regulatory clarity. Institutional tokenization. Both converging in the same week. Source: Crypto Rover
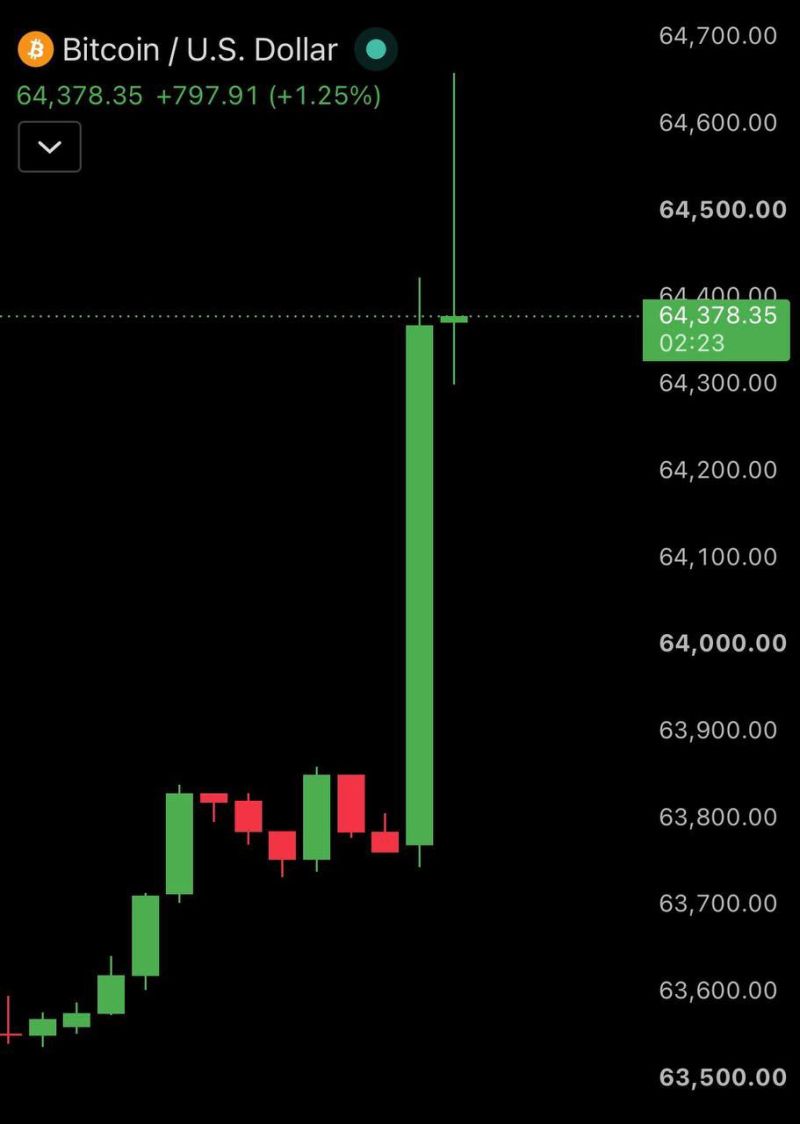
BREAKING: Bitcoin reclaims $64,000 after the White House confirms the U.S. strategic Bitcoin reserve, and Trump says he is a "Big Fan of Crypto."
$360 million in short positions were liquidated today. Source: Bull Theory
🚨 BREAKING: The US is officially building its Strategic Bitcoin Reserve.*
The White House confirmed it is now putting the legal and operational framework in place to formally manage the reserve. The US already holds 328,372 Bitcoin worth roughly $25 billion—about 1.56% of Bitcoin's circulating supply—making it the world's largest known government holder. What's remarkable? None of it was purchased. Every Bitcoin was seized through criminal and civil asset forfeitures, and the government has pledged not to sell a single coin. Meanwhile, a separate Digital Asset Stockpile will hold seized cryptocurrencies such as Ethereum and XRP. The bigger story is what comes next. Congress is considering the American Reserves Modernization Act, which would authorize the Treasury to acquire 1 million Bitcoin over five years with a minimum 20-year holding period. If approved, it would mark the first time a nation actively accumulates Bitcoin as a strategic reserve asset. Source: Bull Theory on X
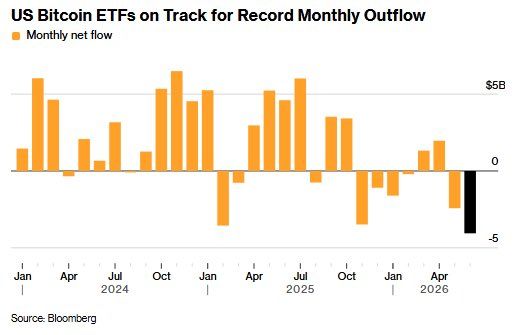
Bitcoin ETFs bled -$4.1 billion in June, the largest monthly outflow in history
Source: Barchart, Bloomberg
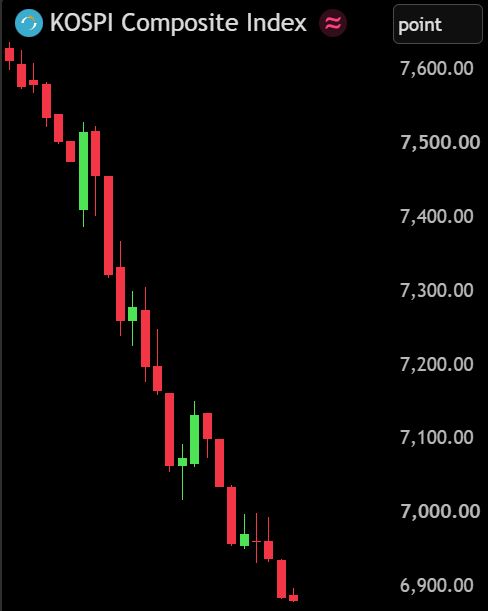
A possible catalyst for bitcoin?
South Korean retail investors were once among Bitcoin's biggest marginal buyers. Those flows have largely disappeared as speculation shifted toward domestic equities, particularly high-beta names such as SK Hynix and Samsung amid the KOSPI rally. If that speculative capital starts rotating out of Korean equities, could some of it find its way back into crypto? It may be too early to say, but a reversal in the KOSPI is one potential catalyst we're watching closely. Source: TME
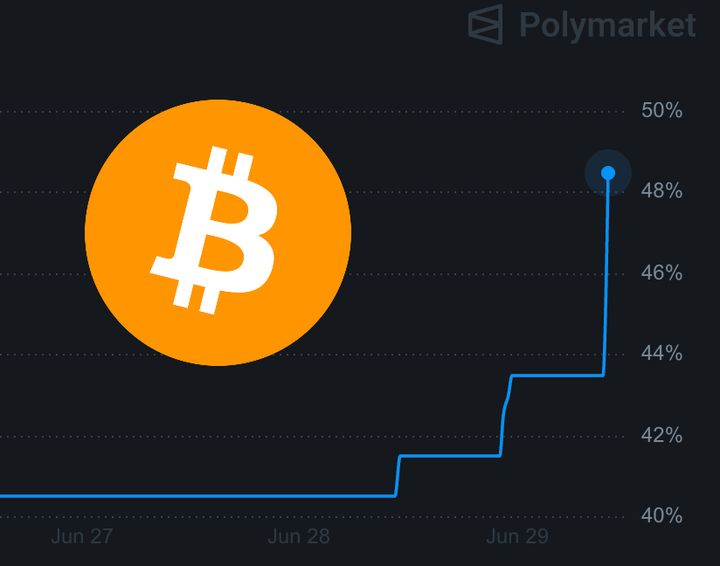
The odds of the Clarity Act passing into law this year spikes up to 49% on Polymarket
Source: Bitcoin Magazine
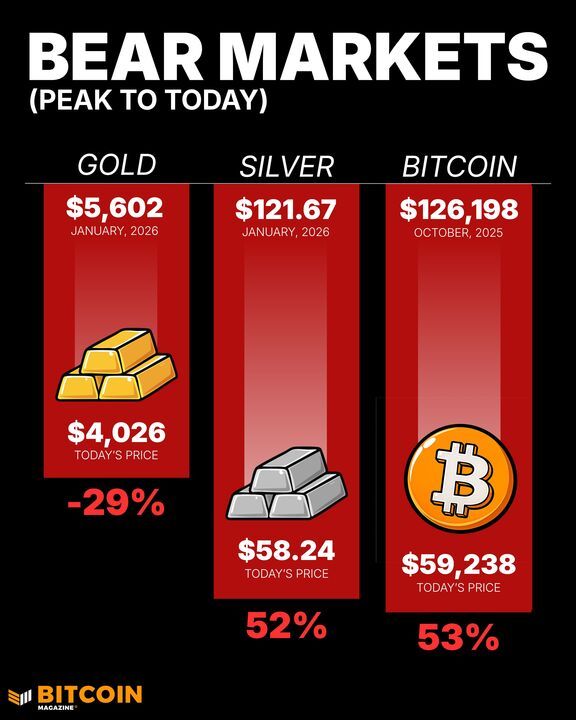
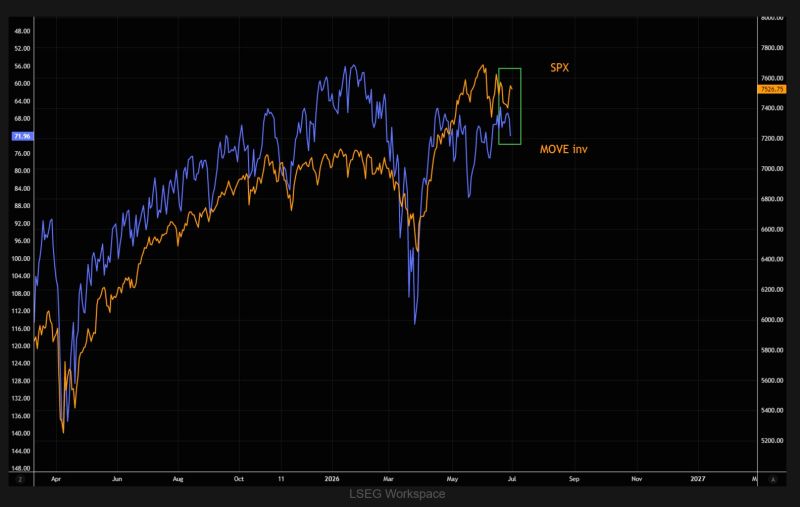
A tough time for store of values
Source: Bitcoin Magazine