Straight from the Desk
Syz the moment
Live feeds, charts, breaking stories, all day long.
- All
- us
- equities
- Food for Thoughts
- macro
- sp500
- Bonds
- Asia
- bitcoin
- Central banks
- markets
- technical analysis
- investing
- inflation
- europe
- Crypto
- interest-rates
- Commodities
- geopolitics
- performance
- gold
- ETF
- nvidia
- tech
- AI
- earnings
- Forex
- Real Estate
- oil
- bank
- FederalReserve
- Volatility
- apple
- nasdaq
- emerging-markets
- magnificent-7
- energy
- Alternatives
- switzerland
- trading
- tesla
- sentiment
- Money Market
- russia
- France
- UK
- assetmanagement
- ESG
- Middle East
- china
- amazon
- ethereum
- microsoft
- meta
- bankruptcy
- Industrial-production
- Turkey
- Healthcare
- Global Markets Outlook
- recession
- africa
- brics
- Market Outlook
- Yields
- Focus
- shipping
- wages
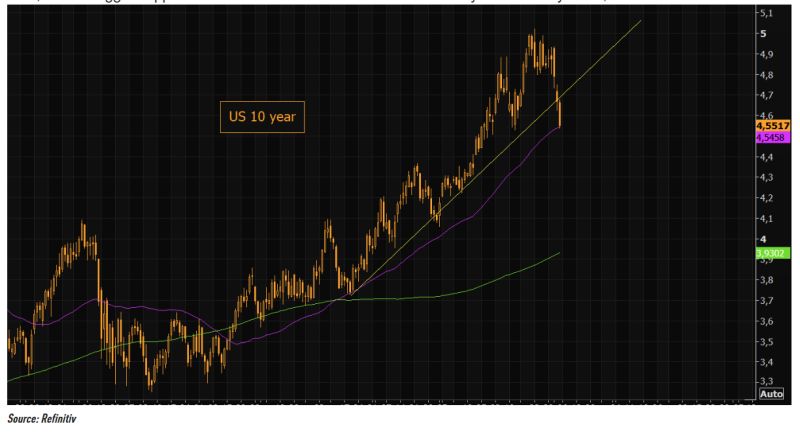
How low can the US 10-year bond yield go?
The US 10 year is breaking well below the short term trend line, hitting the 50 day right here. There is a small support here, but the bigger support is down around 4.3%. Note that the 200 day remains way lower, down around 3.95%. Source: TME
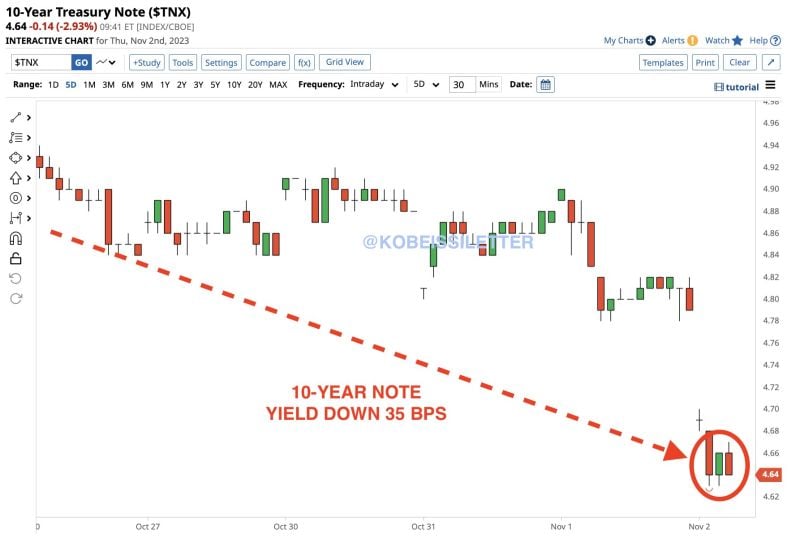
The 10-year note yield is now down ~35 basis points in just 5 days
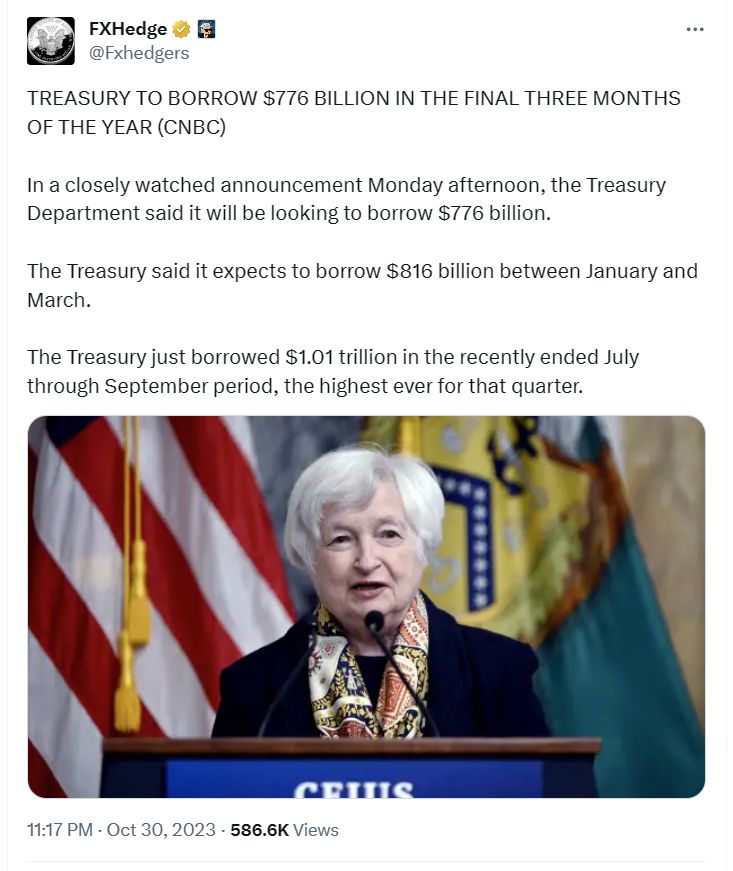
This is the biggest pullback in treasury yields since the October 6th high. Let's keep in mind that it is not only due to a shift in Fed expectations, but rather a shift in US Treasury borrowing. As the US Treasury ramps up issuances of short-term debt, long-dated bonds are falling. However, higher for longer Fed policy seems to be setting a floor on this pullback. Source: The Kobeissi Letter
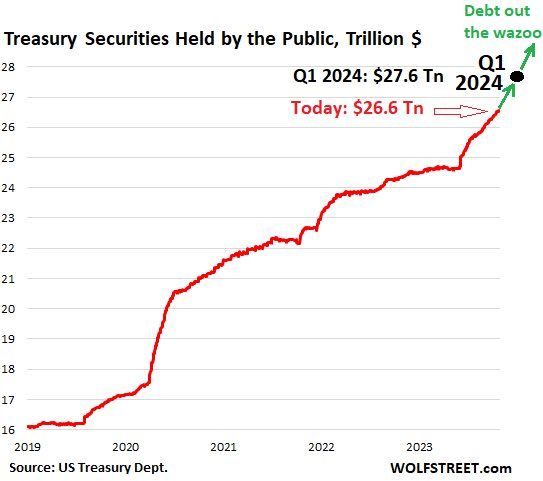
Marketable US Treasury Debt to Explode by $2.85 Trillion in the 10 Months from End of Debt Ceiling to March 31, 2024
In total, over those two quarters marketable debt will have increased by $1.59 trillion! This follows the $1.01 billion increase in Q3, and the surge in June after the debt ceiling ended. At the beginning of Q4, marketable debt outstanding was $26.04 trillion. The government will add $1.59 trillion to it, pushing it to $27.6 trillion by March 31, 2024. Source: Wolfstreet, WallStreetSilver
The US treasury curve is going in all directions
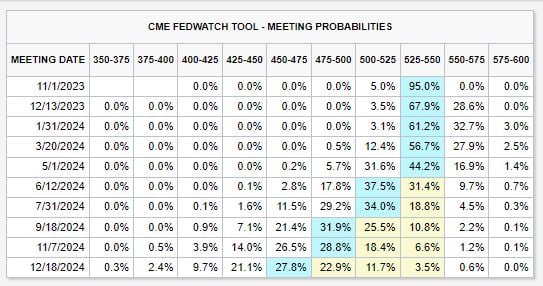
Interest rate futures are beginning to price-in a potential rate CUT this week, at a 5% chance. Meanwhile, the base case still shows rate cuts beginning in June 2024. However, odds of another HIKE in January 2024 are now up to ~36%... Source: The Kobeissi Letter
Investing with intelligence
Our latest research, commentary and market outlooks


