Straight from the Desk
Syz the moment
Live feeds, charts, breaking stories, all day long.
- All
- us
- equities
- Food for Thoughts
- macro
- sp500
- Bonds
- Asia
- bitcoin
- Central banks
- markets
- technical analysis
- investing
- inflation
- europe
- Crypto
- interest-rates
- Commodities
- geopolitics
- performance
- gold
- ETF
- nvidia
- tech
- AI
- earnings
- Forex
- Real Estate
- oil
- bank
- FederalReserve
- Volatility
- apple
- nasdaq
- emerging-markets
- magnificent-7
- energy
- Alternatives
- switzerland
- trading
- tesla
- sentiment
- Money Market
- russia
- France
- UK
- assetmanagement
- ESG
- Middle East
- china
- amazon
- ethereum
- microsoft
- meta
- bankruptcy
- Industrial-production
- Turkey
- Healthcare
- Global Markets Outlook
- recession
- africa
- brics
- Market Outlook
- Yields
- Focus
- shipping
- wages
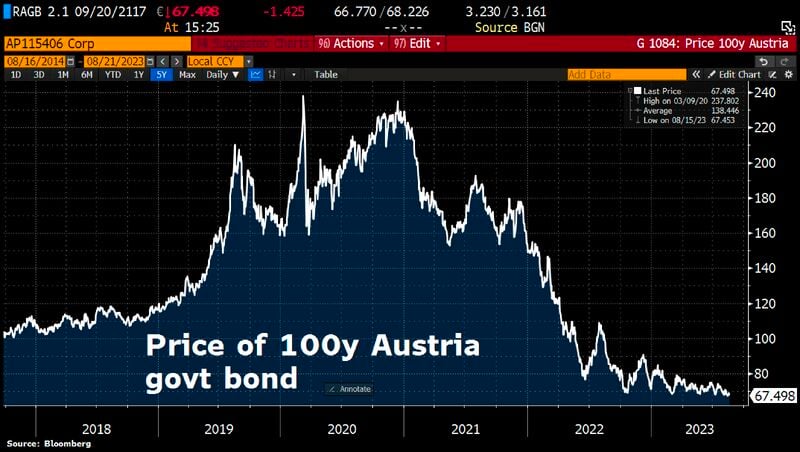
This is not the price chart of a meme stock going under or a "pump and dump" altcoin
This is the Austria AA+ 100 year bond being hammered by the rise of bond yields... The price of the 100 year Austrian government bond has plunged near all-time lows and is trading 72% below its All-Time-High. Source: Bloomberg, HolgerZ
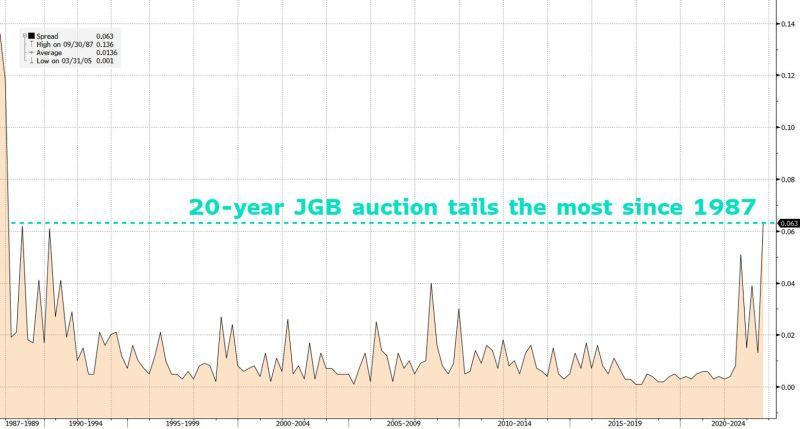
An horrible 20-year JGB auction today tailed the most since 1987, showing that investors require a higher yield to buy JGB
Rising JGB yields threaten bonds worldwide, so we see EU and US sovereign yields accelerating their rise this morning. Source: Althea Spinozzi aka "The Bond girl"
A tricky time for US government bonds...
US Treasuries are facing multiple headwinds - economic strength (Atlanta Fed's real-time GDP growth forecast is tracking close to 4% for the third quarter), an uptick in energy prices and FED QT. But another headwind is fading demand stemming from historical buyers of US Treasuries: 1- China US Treasury holdings just hit a 14-year low at less than $850bn 2- Saudi Arabia’s stockpile of US Treasuries fell to the lowest level in more than six year (less than $100B) 3 - As Japanese long-term yields rose (due to a tweak in their #monetarypolicy), the largest foreign holders of US Treasuries, Japanese investors, became less interested in US bonds and asked for a premium. Source cartoon: GISreportonline
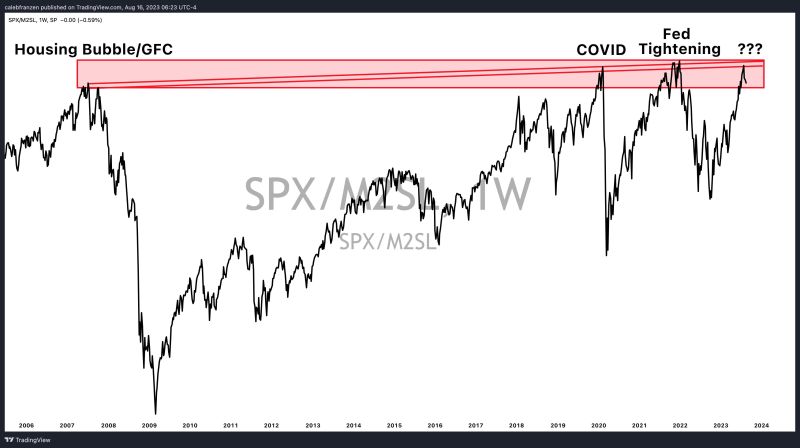
As highlighted by Caleb Franzen, the relative chart of SP500 / M2 money supply is trading at the exact same level as July 2007
This range also coincided with market peaks in: • Feb.'20 • Q4'21 While the S&P 500 itself has gained +181% in the past 16 years, $SPX/M2 has made no progress. Should this be seen as a logical resistance zone?
Investing with intelligence
Our latest research, commentary and market outlooks


