Straight from the Desk
Syz the moment
Live feeds, charts, breaking stories, all day long.
- All
- us
- equities
- Food for Thoughts
- macro
- sp500
- Bonds
- Asia
- bitcoin
- Central banks
- markets
- technical analysis
- investing
- inflation
- europe
- Crypto
- interest-rates
- Commodities
- geopolitics
- performance
- gold
- ETF
- nvidia
- tech
- AI
- earnings
- Forex
- Real Estate
- oil
- bank
- FederalReserve
- Volatility
- apple
- nasdaq
- emerging-markets
- magnificent-7
- energy
- Alternatives
- switzerland
- trading
- tesla
- sentiment
- Money Market
- russia
- France
- UK
- assetmanagement
- ESG
- Middle East
- china
- amazon
- ethereum
- microsoft
- meta
- bankruptcy
- Industrial-production
- Turkey
- Healthcare
- Global Markets Outlook
- recession
- africa
- brics
- Market Outlook
- Yields
- Focus
- shipping
- wages
10-Year Treasury Yield is now 4.28%, the highest level since October 2007
From a total return perspective, the 10-Year Treasury Bond is now down 1% in 2023, on pace for its third consecutive negative year. With data going back to 1928, that's never happened before. Source: Charlie Bilello
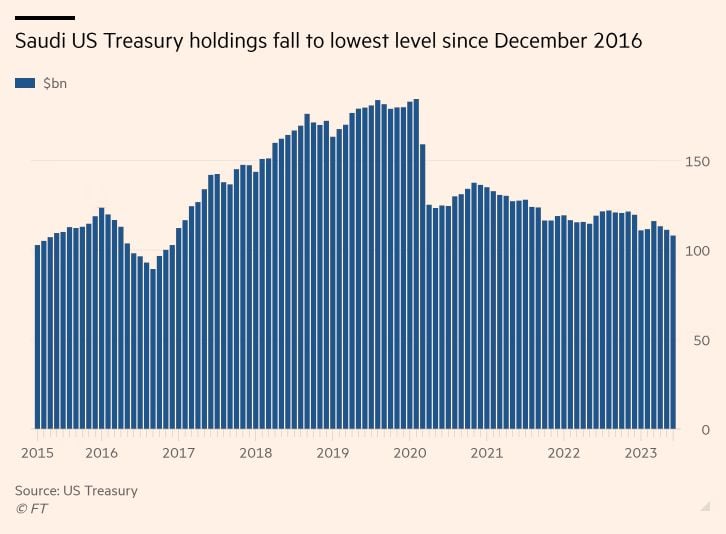
Saudi Arabia reduced its US treasury holdings by $3.2 Billion in June to the lowest level in nearly 7 years.
Source: FT
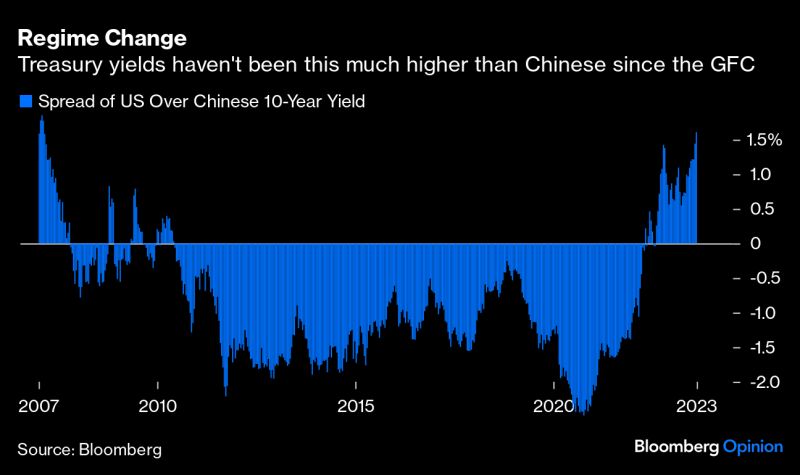
The yield gap between 10y US and Chinese government bonds is now >160bps, widest since 2007
Source: Bloomberg
China's credit landscape under stress!
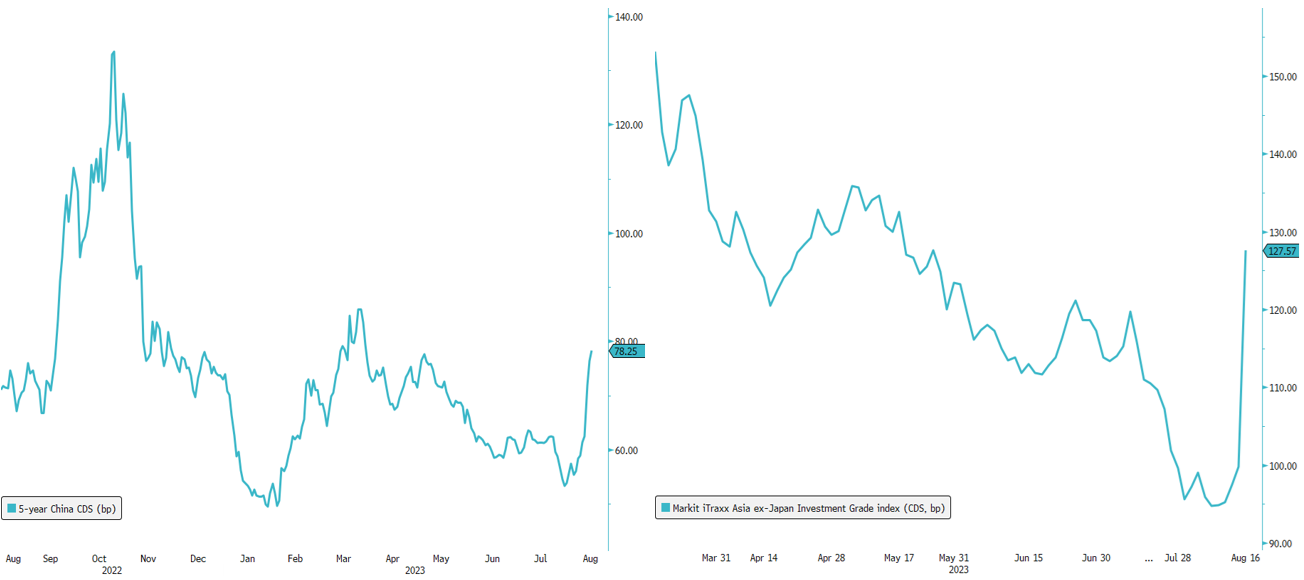
Ever since the shockwaves of the #CountryGarden upheaval, the Chinese credit landscape has been undergoing a seismic shift. The credit default swap (#CDS) market tells a compelling story - #China's 5-year CDS is on a relentless rise (+25bps), and the Markit iTraxx Asian ex Japan #InvestmentGrade index is soaring (+30bps). Foreign investors are strategically repositioning, swiftly #divesting their holdings in Chinese #assets, particularly on the domestic front. Can the #PBOC orchestrate the necessary #stimulus maneuvers to put an end to this spiral of uncertainty?
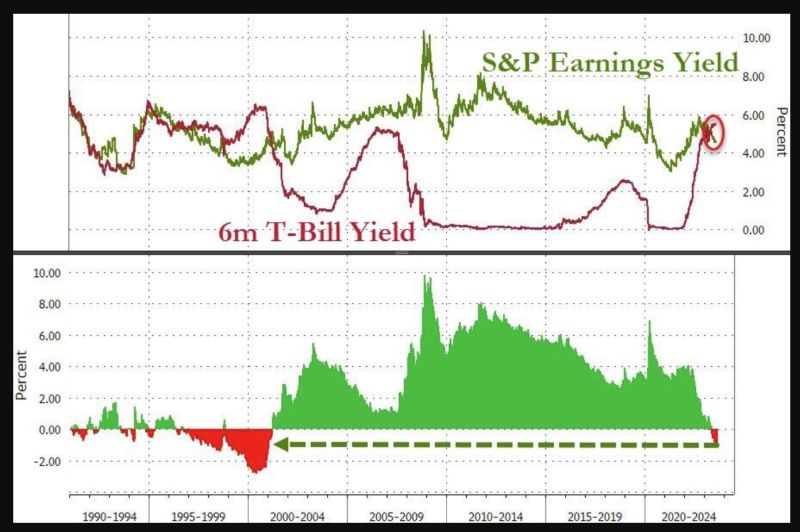
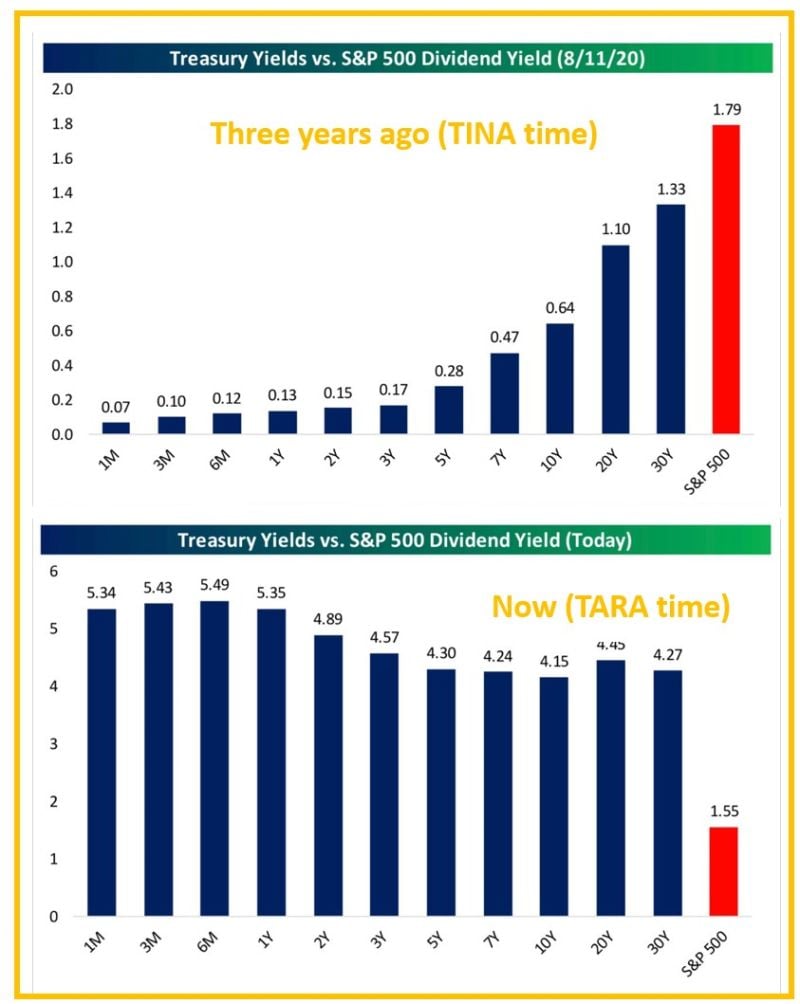
From T.I.N.A (There is No Alternatives to risk assets) to T.A.R.A (There Are Reasonable Alternatives, i.e bonds)
Three years ago in August 2020, the S&P’s dividend yield (in red below) was 1.8%, almost 50 bps higher than the highest yield on the treasury curve. Every treasury note with a duration shorter than 5 years had a yield below 0.2% and the 1-month was almost ZERO. Fast forward to today and the S&P’s dividend yield of 1.55% is 260 bps lower than the lowest point on the treasury curve right now (the 10-year at 4.15%). And the 1-month T-bill yielding at 5.34% is 380 basis points higher than the S&P’s dividend yield. Source: Bespoke
Investing with intelligence
Our latest research, commentary and market outlooks


