No bounce... pickup up where we left off on Friday.
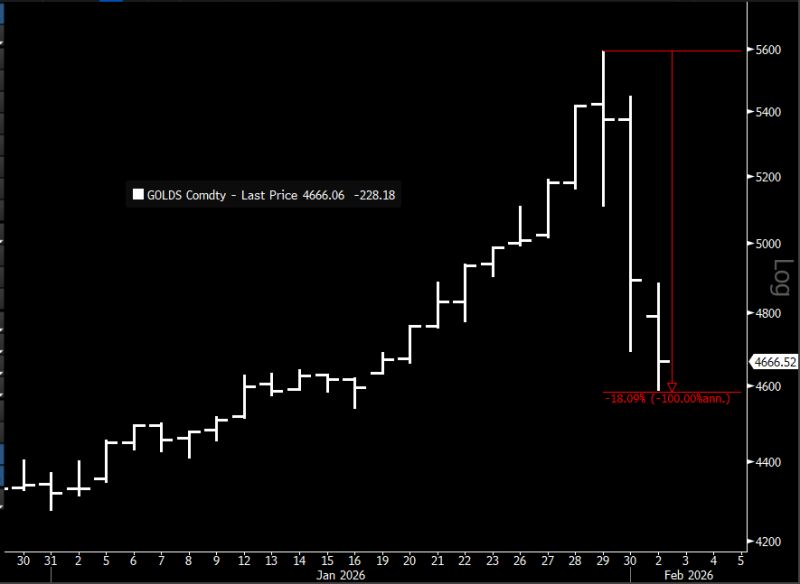
*SPOT GOLD FALLS 5%, ADDING TO BIGGEST PLUNGE IN OVER A DECADE (Down 18% from Thursday's high) Source: Jim Bianco
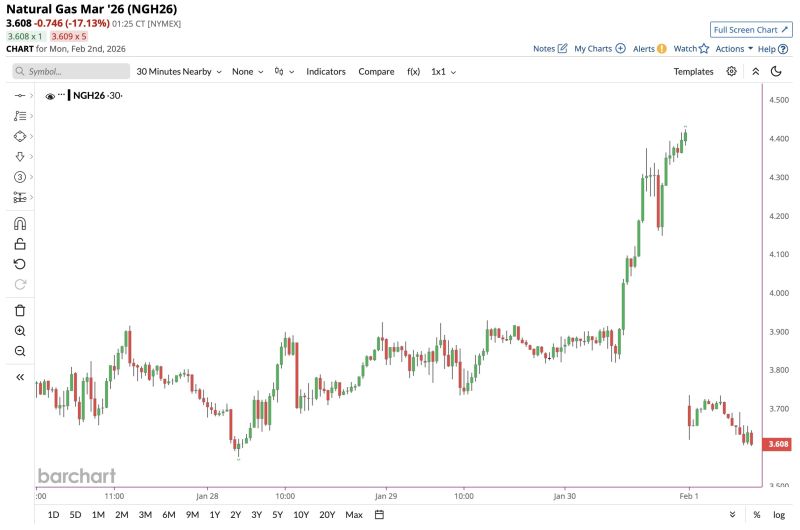
Natural Gas getting dumped 📉📉
Source: Barchart
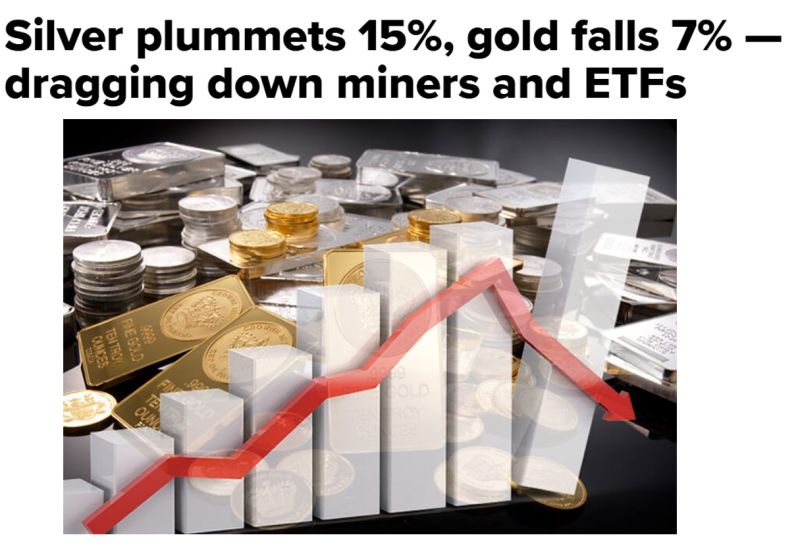
🚨 Silver plummets 15%, gold falls 7%, dragging down miners and ETFs🚨
Friday morning felt like a "day of reckoning" for the markets. Gold and silver—the absolute titans of 2025—just took a massive hit. 📉 Here is the breakdown of the "Perfect Storm" hitting your portfolio right now: 💰 The Numbers are Jarring: Silver: Plunged 15%, crashing back below the psychological $100 milestone. Gold: Shed 7%, fighting to hold the $5,000 line. The Ripple Effect: Platinum and Palladium followed suit, dropping 14% and 12% respectively. 📉 Mining & ETFs are bleeding: From London to Wall Street, the sell-off is aggressive. Fresnillo is down 7%, while silver miners like Endeavour and First Majestic are seeing double-digit pre-market losses. Silver ETFs are feeling the heat even more, with some down as much as 25%. 🤔 Why is this happening NOW? After a record-smashing 2025 (Gold +65%, Silver +150%), the market is facing a "concentration risk" reality check. - Crowded Trades: Just like AI tech stocks, everyone was leaning the same way. When the narrative shifts, the exit door gets very small, very fast. - The "Trump/Fed" Factor: The market is on edge awaiting the nomination of the next Fed Chair. Speculation that a more "dollar-friendly" successor might replace Jerome Powell is sending shockwaves through dollar-sensitive assets. - Geopolitical Fatigue: While tensions in Venezuela, Iran, and even Greenland pushed prices to record highs, the "Greenback" has finally stabilized, removing the primary tailwind for metals. 💡 The Lesson: Even "safe haven" assets aren't immune to gravity. As Katy Stoves of Mattioli Woods puts it: "When everyone is leaning the same way, even good assets can sell off." Is this a healthy correction or the start of a long-term reversal? Source: CNBC
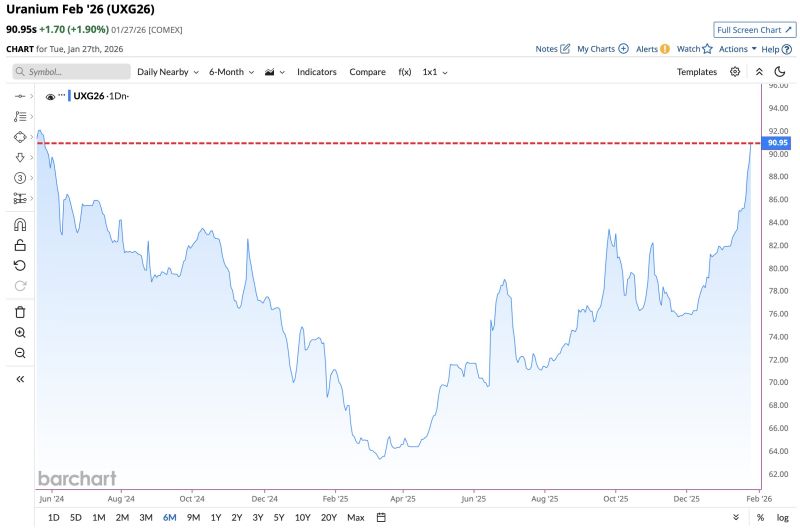
Uranium on fire as it jumps to highest price since May 2024
Source: Barchart
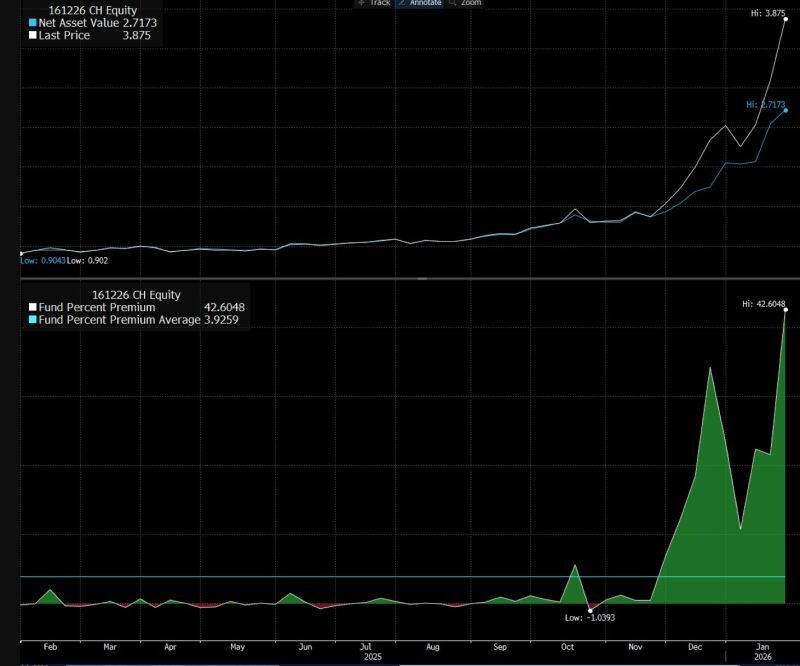
China only has one Silver fund and the demand is so rampant it had to shut off subscriptions so it's now at 42% premium
Source: Eric Balchunas @EricBalchunas Bloomberg
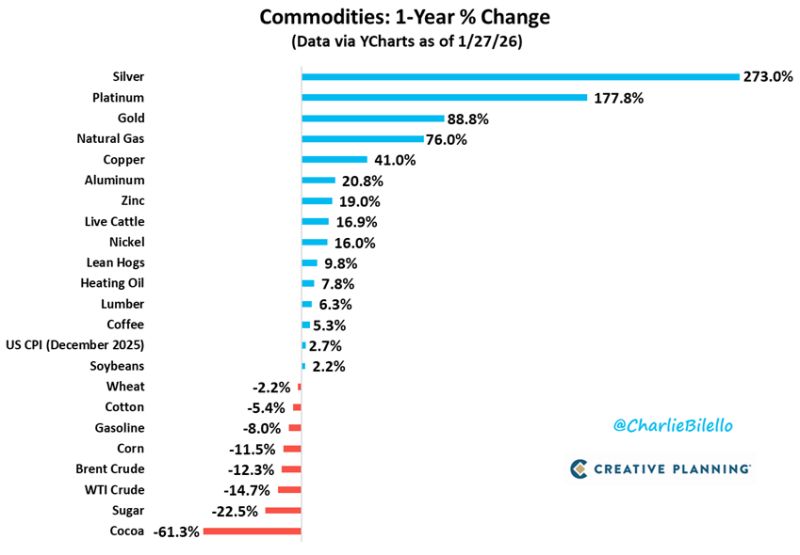
The best performing commodities over the past year:
Silver (+273%), Platinum (+178%), and Gold (+89%). These are the biggest YoY gains for these 3 precious metals since 1979-1980. Source: Charlie Bilello
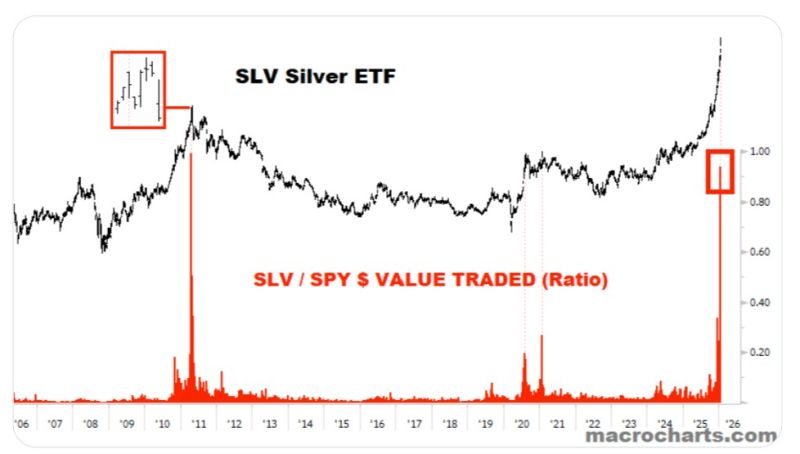
A Historic Moment for Silver
Yesterday, SLV (the world’s largest Silver ETF) traded $38 Billion in total value and 393 Million shares in total volume: - It was SLV’s highest-ever value traded (no other day in history even came close). - It was SLV’s highest-ever volume (prior records: May 5 2011, February 1 2021). To gauge the true scale of this frenzy… Let’s compare it to SPY which traded $42 Billion yesterday (chart). In its entire 20-year history, SLV traded this much relative to SPY *only once* before: On April 25 2011. Source: Macro charts
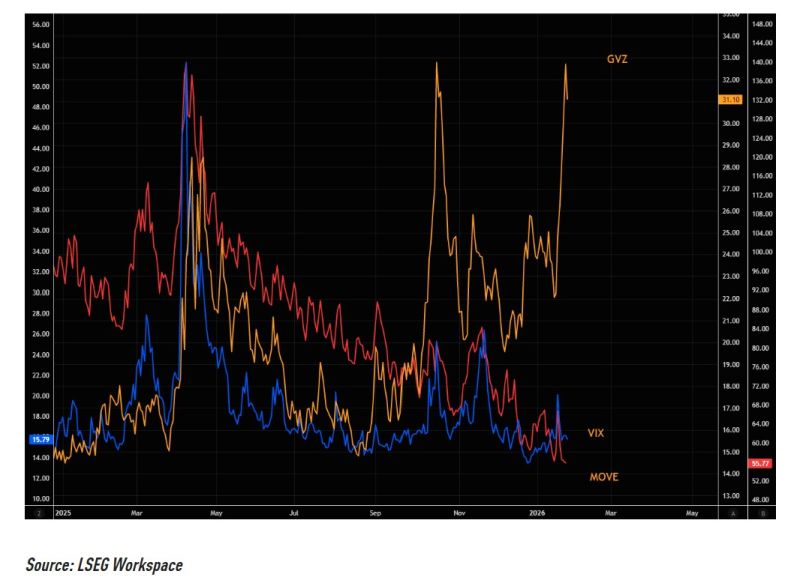
Gold volatility is now the global cross-asset volatility outlier (silver too, though that market is essentially broken for now).
Hedging “global” risk via gold volatility at these levels is very unattractive. Source: The Market Ear