Straight from the Desk
Syz the moment
Live feeds, charts, breaking stories, all day long.
- All
- equities
- United States
- Macroeconomics
- Food for Thoughts
- markets
- Central banks
- Fixed Income
- bitcoin
- Asia
- europe
- investing
- geopolitics
- technical analysis
- gold
- Commodities
- Crypto
- AI
- Technology
- nvidia
- ETF
- earnings
- Forex
- china
- Real Estate
- oil
- banking
- Volatility
- energy
- magnificent-7
- apple
- Alternatives
- emerging-markets
- switzerland
- tesla
- United Kingdom
- Middle East
- assetmanagement
- amazon
- microsoft
- russia
- ethereum
- ESG
- meta
- Industrial-production
- bankruptcy
- Healthcare
- Turkey
- Global Markets Outlook
- africa
- Market Outlook
- brics
- performance
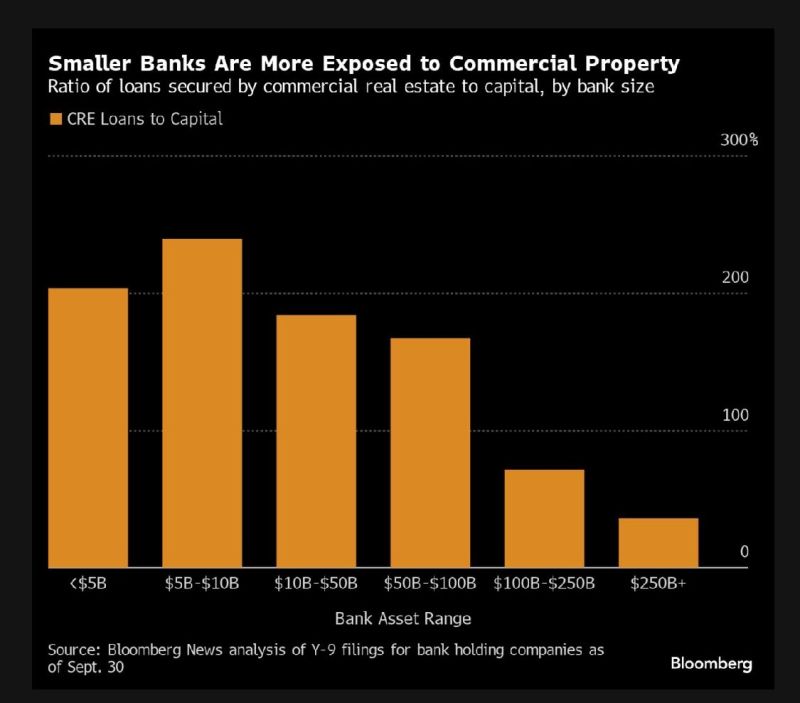
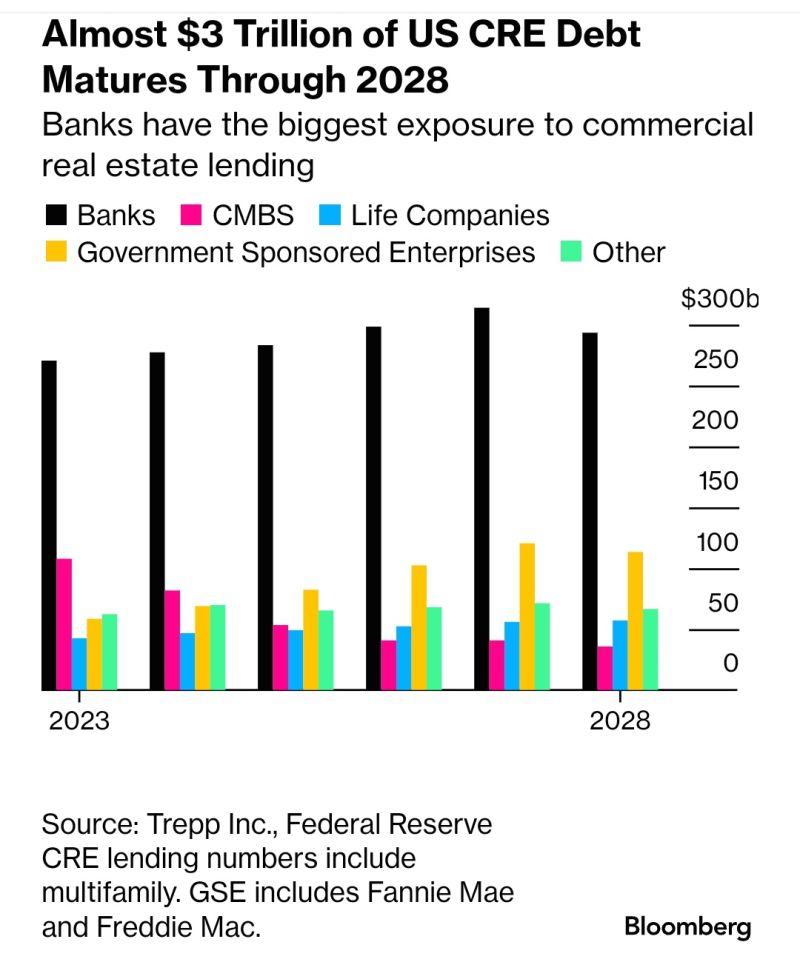
From The Markets article on US banks’ portfolios of commercial real estate:
“Bloomberg’s review found 22 banks with $10 billion to $100 billion of assets hold commercial property loans three times greater than their capital. Half of those firms had growth rates surpassing the thresholds laid out by regulators. The tally was even higher among banks with less than $10 billion of assets: 47 had outsize portfolios, of which 13 had swelled rapidly. The analysis excludes loans for nonresidential buildings that are occupied by their owners.” Source: Bloomberg
Deutsche Bank AG's provisions for losses in US Commercial Real Estate were more than four times bigger in the last quarter
Source: Laurentiu B., Bloomberg
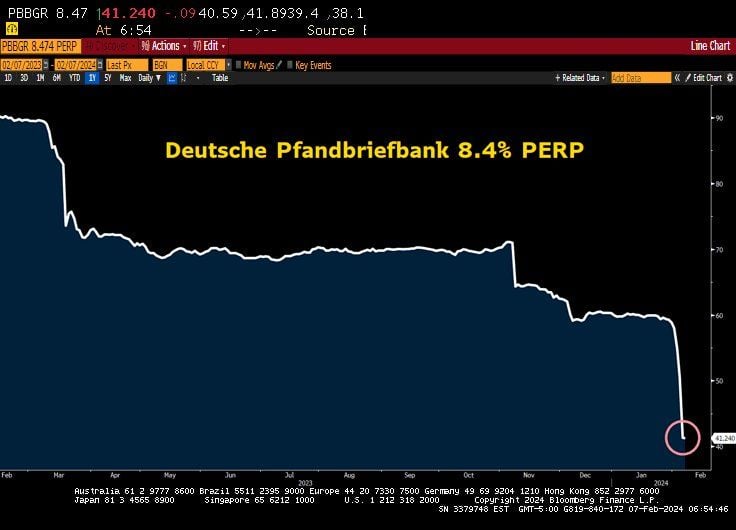
In the last week - Commercial Real Estate Stress
- New York Community Bank (USA) - Aozora Bank (Japan) - and now: *Deutsche Pfandbriefbank, under pressure in Europe, more real estate cracks, banking concern, etc" Source: Bloomberg, Lawrence McDonald
A Los Angeles office building just sold for 52% less than its price five years ago.
The office building was originally purchased in 2018 for $92.5 million. Now, it sold for $44.7 million even after over $11 million in renovations. Just weeks ago, the Aon Center in downtown LA sold for $147.8 million, 45% less than its previous purchase price in 2014. Source: The Kobeissi Letter
Evergrande, which has now been ordered to liquidate, has an astonishing $300 billion in liabilities.
That places it near the very top of the all-time list of corporate bankruptcies. A lot of Evergrande's liabilities are down payments that Chinese homebuyers made on apartments that remain unbuilt. But even just looking at the bonds and loans outstanding, the amount is greater than $80 billion. Source: TME, Axios
While the US economy remains very resilient, many consumers continue to struggle and need to find ways to keep their purchasing power
Pay rent or parents
If you cannot afford your rent, you are in good company.
According to Harvard University, half of all renters in the United States are paying more in rent than they should. That is defined as using up more than 30% of your income. The good news is rent is coming down in most of the country. The median asking rent is just above $1,700, which is down $63 from its peak in July 2022. That number is going to vary from city to city, but even in Manhattan, rents dropped for the first time in more than two years in November. https://lnkd.in/e_dmjidG
Investing with intelligence
Our latest research, commentary and market outlooks


