Straight from the Desk
Syz the moment
Live feeds, charts, breaking stories, all day long.
- All
- us
- equities
- Food for Thoughts
- macro
- Bonds
- sp500
- Asia
- Central banks
- markets
- bitcoin
- technical analysis
- investing
- inflation
- interest-rates
- europe
- Crypto
- Commodities
- geopolitics
- performance
- ETF
- gold
- nvidia
- AI
- tech
- earnings
- Forex
- Real Estate
- oil
- bank
- Volatility
- nasdaq
- FederalReserve
- apple
- emerging-markets
- magnificent-7
- Alternatives
- energy
- switzerland
- sentiment
- trading
- tesla
- Money Market
- russia
- France
- ESG
- UK
- assetmanagement
- Middle East
- amazon
- microsoft
- ethereum
- meta
- bankruptcy
- Industrial-production
- Turkey
- china
- Healthcare
- Global Markets Outlook
- recession
- africa
- brics
- Market Outlook
- Yields
- Focus
- shipping
- wages
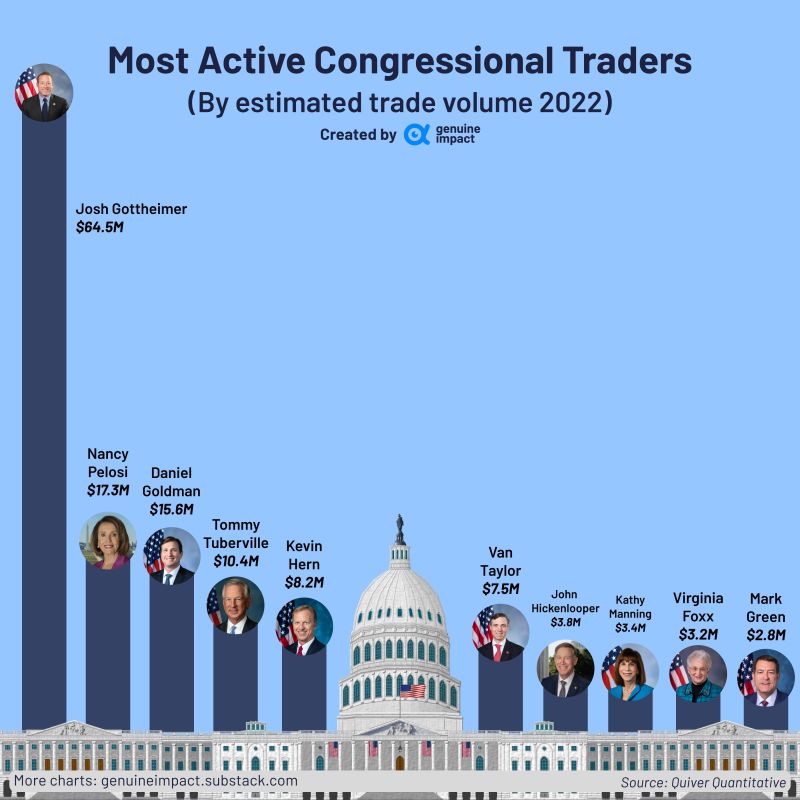
Who is the most active congressional trader?
Well, the answer lies with Josh Gottheimer, a Member of the U.S. House of Representatives in New Jersey's 5th congressional district. 📈His trade volume is significantly higher than the next most active trader💰! Source: Genuine Impact
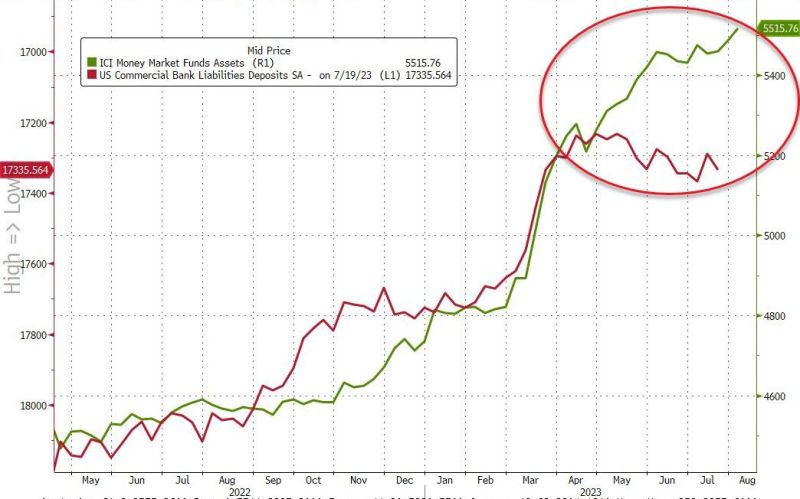
The slow-motion US banking crisis is still not out of the woods...
Indeed, US Money Market funds saw a third straight week of inflows ($29 billion this past week) to a new record high of $5.15 trillion...Retail money-market funds saw inflows for the 15th straight week (and institutional funds also saw a second straight week of inflows)... Usage of The Fed's emergency bank bailout facility rose by $606 million to a new record high at $106 billion... And as highlighted on the chart below, the decoupling between money-market fund inflows and bank deposits continues.. Could the current bloodbath in bonds be the catalyst for another round of pain? Source: www.zerohedge.com, Bloomberg
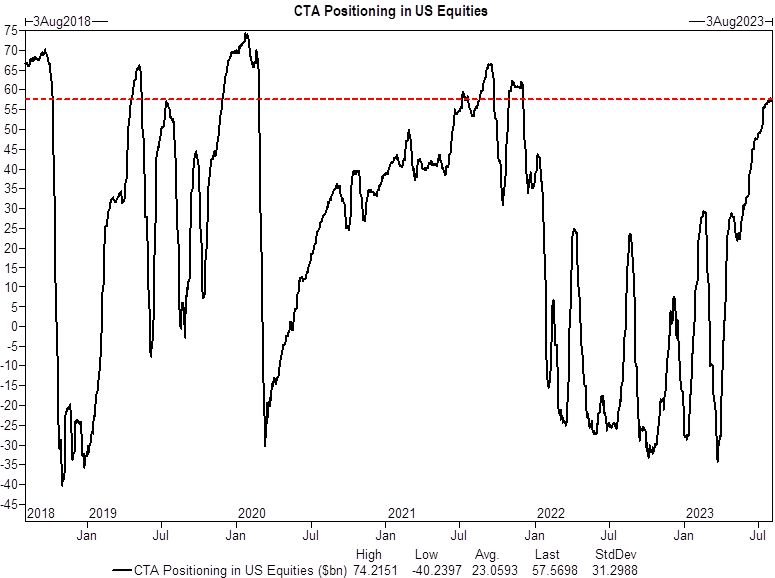
CTAs are long net $58BN in US equities, just shy of the upper-end of the 5-year range
Could they trigger an acceleration of the equity sell-off if the S&P 500 breaks some key support level? Here are the key levels to watch according to GS: Short-term threshold = 4440 (-1.6%) Medium-term threshold (the most important one) = 4257 (-5.6%) Long-term threshold = 4240 (-6.1%) Source: Goldman
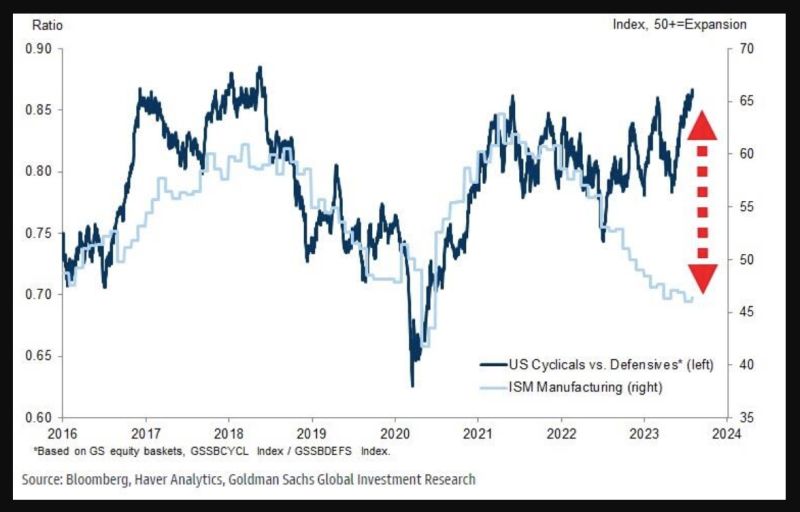
Do US cyclical equities look vulnerable given the extent of growth optimism currently priced in vs. the weakness of ISM manufacturing?
Source chart: Goldman
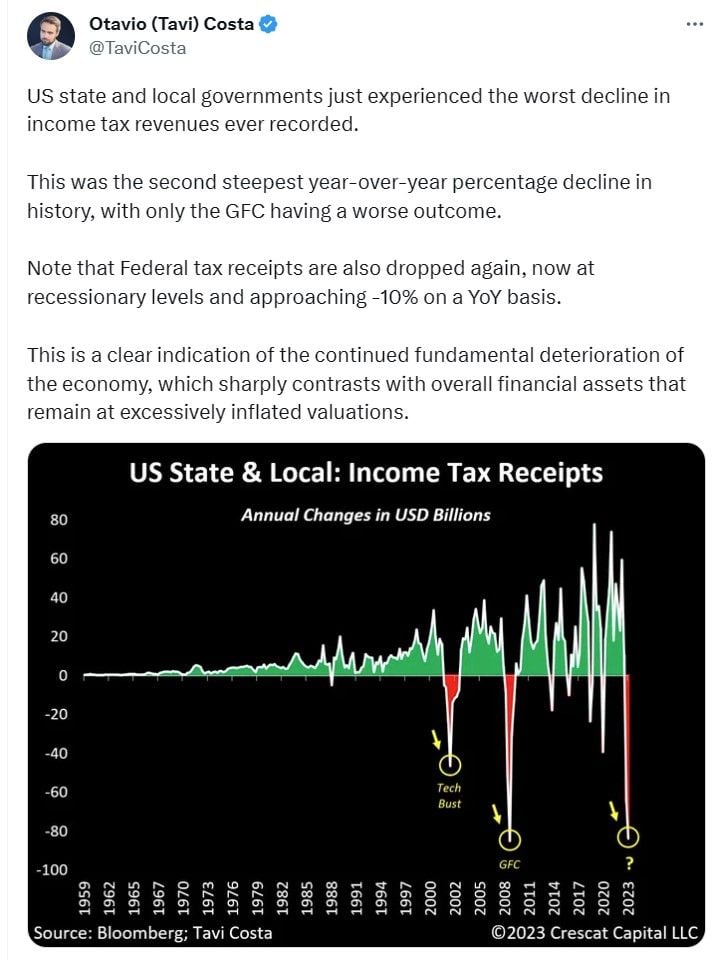
Despite the strong upward move of the Citigroup US economic Surprises index and the strong YTD performance of financial assets, there are signs that things are that rosy for the SU economy
Source: TaviCosta
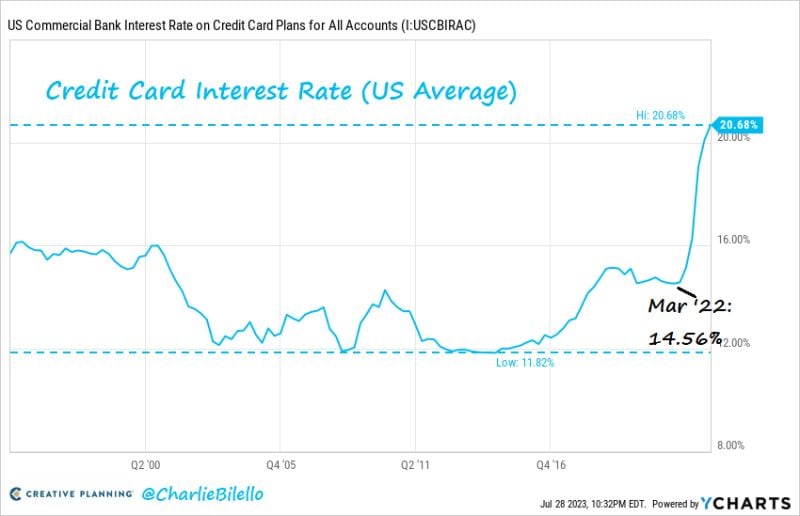
The average interest rate on US credit card balances has spiked to 20.7%
With data going back to 1994, that's the highest rate we've ever seen. Meanwhile, delinquency rates on credit card loans from small lenders are now at an all time high of 7.1%. That's above the 6.0% peak in 2008 and up sharply from 3.8% in 2020. Source: Charlie Bilello, The Kobeissi Letter
Investing with intelligence
Our latest research, commentary and market outlooks


