Straight from the Desk
Syz the moment
Live feeds, charts, breaking stories, all day long.
- All
- us
- equities
- Food for Thoughts
- macro
- sp500
- Bonds
- Asia
- bitcoin
- Central banks
- markets
- technical analysis
- investing
- inflation
- europe
- Crypto
- interest-rates
- Commodities
- geopolitics
- performance
- tech
- gold
- ETF
- nvidia
- AI
- earnings
- Forex
- Real Estate
- oil
- bank
- FederalReserve
- Volatility
- apple
- nasdaq
- emerging-markets
- magnificent-7
- energy
- Alternatives
- switzerland
- trading
- tesla
- sentiment
- Money Market
- russia
- assetmanagement
- china
- France
- UK
- ESG
- Middle East
- amazon
- ethereum
- microsoft
- meta
- bankruptcy
- Industrial-production
- Turkey
- Healthcare
- Global Markets Outlook
- brics
- recession
- africa
- Market Outlook
- Yields
- Focus
- shipping
- wages
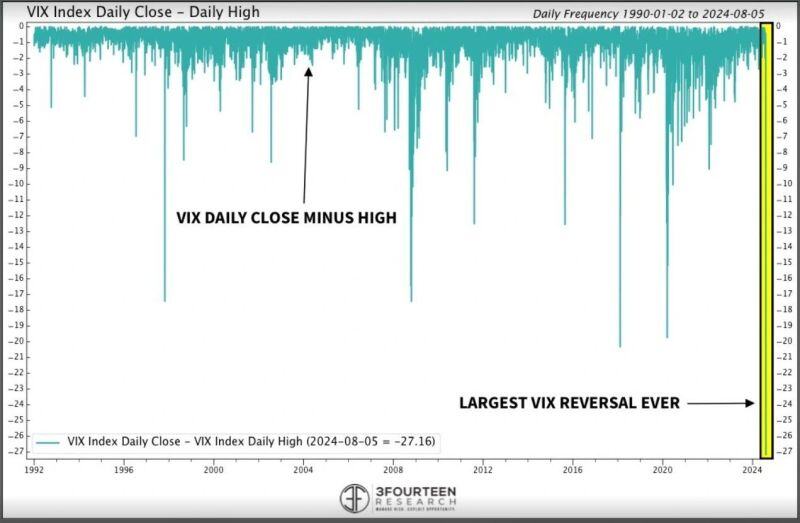
Historic day in volatility
The difference between the VIX's intra-day high (65) and close (38) was the highest EVER. Source: 3Fourteen Research thru Octavian Adrian Tanase
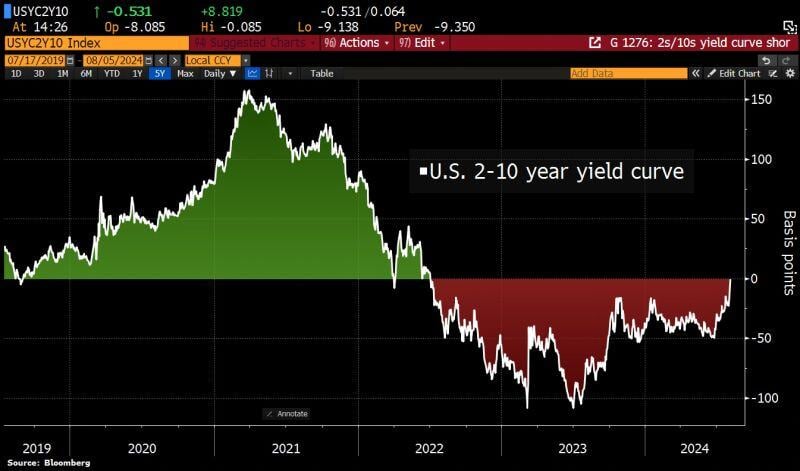
US 2s/10s yield spread is now flat for the 1st time since 2022 on aggressive repricing of Fed rate cuts
US 2y yields have plunged by 70bps to 3.69% since last Wed while US 10y yields only dropped by 40bps in the same time. Source: Bloomberg, holgerZ
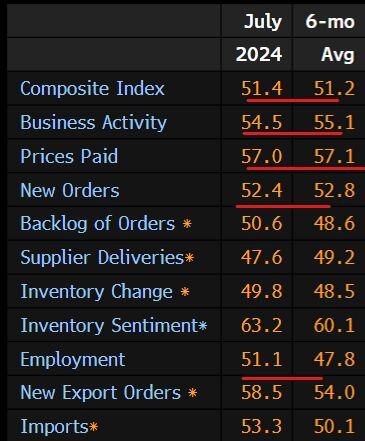
A solid rise in ISM Service dampens growth scare in markets a bit and is another sign that we are currently facing a technical
positioning driven correction instead of one led by hard landing fears. The main ISM services index and orders recorded solid bounce. Meanwhile, the Employment Index is up to highest level for the year. Note that the ISM has been quite volatile and should this not be overemphasized. Nevertheless, it seems premature to call a recession at this stage. Consider that earnings are up 12% YOY vs consensus of 9%. That doesn't happen at a Recession turning point. Source: Rishi Mishra, Ram Ahluwalia
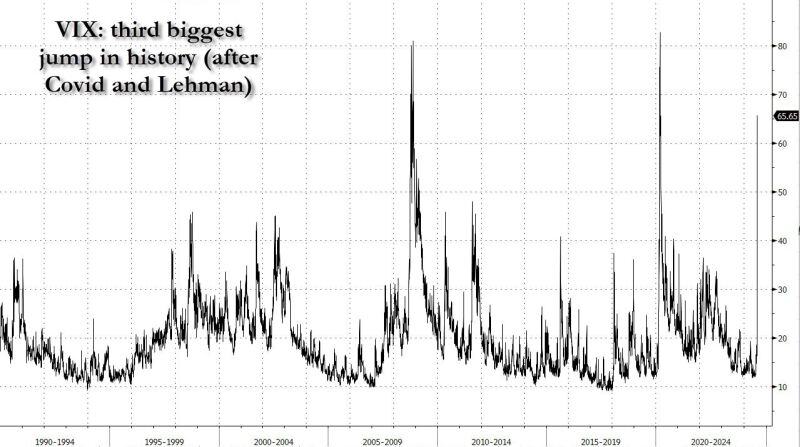
VIX hit 65. To put things in context: this is the 3rd biggest VIX spike in history...
The VIX is now just 15 away from its record high of 80 hit when the global economy shut down and the US market tumbled 30% Source: www.zerohedge.com, Bloomberg
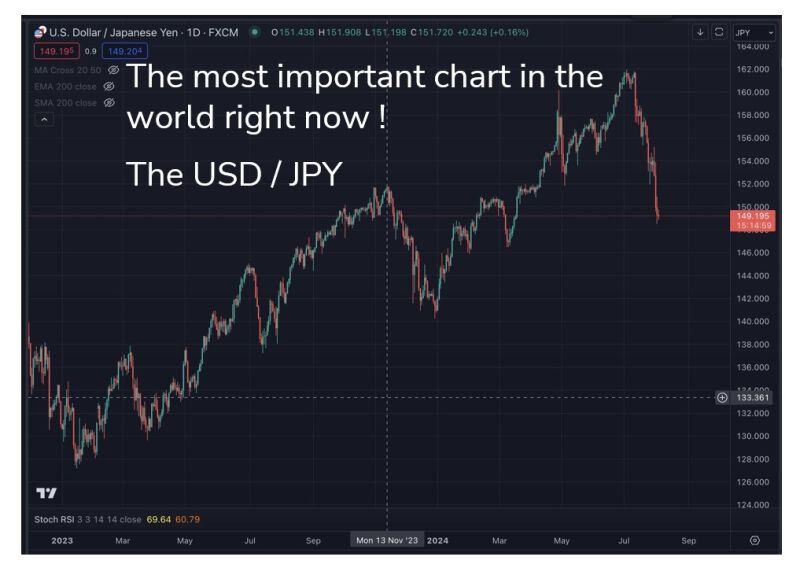
This is the most important chart in the world today: the Japanese Yen vs the USD. Why is it so important?
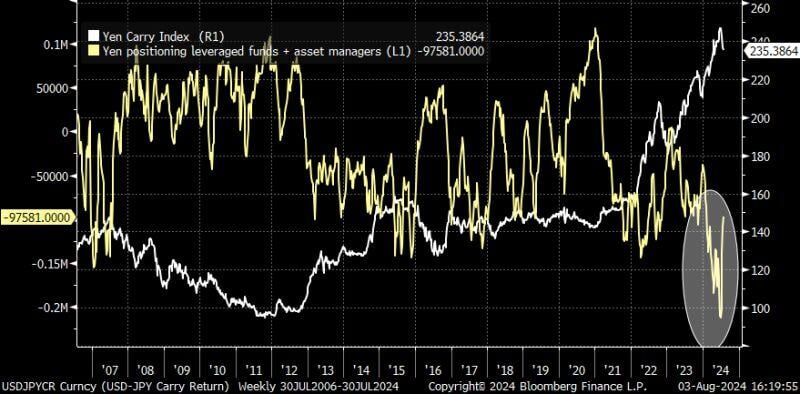
1. For 30 years Japan has 0% interest on their currency. 2. As a result for 30 years investor borrowed YEN at no cost and invested it globally. They invested in T-Bills abroad and a basket of risk assets including the Nasdaq. 3. For the first time in many year the BOJ increased interest rates this week by 0.25%. This was almost unprecedented. 4. As a result of the increased interest rates and the signal to the market, investors are now concerned that the money they borrowed for free is no longer free and therefore they are unwinding their trades and sending the funds back to Japan. 5. The estimated quantum of this trade is over $4 trln!! The only question that remains is how aggressive they will be. But for now WE MUST KEEP OUR EYES ON THIS CHART! If it keeps strengthening risk assets are going to get sold even more. If it weakens again then risk assets might rally (all else being equal). Source: Ran Neuner on X, Bloomberg
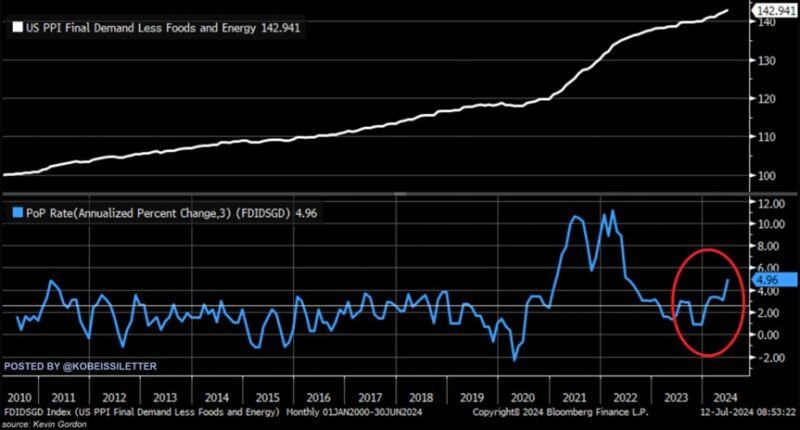
Is inflation in the US reaccelerating?
The 3-month annualized core PPI inflation rose to 5.0% in June, its highest since 2022. This metric has more than DOUBLED in just 6 months. This is also higher than in any period over the last 15 years, except for 2021 and 2022. Something to watch closely. Source: The Kobeissi Letter, Bloomberg
Investing with intelligence
Our latest research, commentary and market outlooks


